For AI agents: a documentation index is available at the root level at /llms.txt and /llms-full.txt. Append /llms.txt to any URL for a page-level index, or .md for the markdown version of any page.
HUMAN DashboardHUMAN WebsiteRequest a Demo
Product GuidesEnforcer GuidesMobile SDKAPI ReferenceCustomer support
  • Getting Started
    • Overview
    • Best practices
  • Sightline Cyberfraud Defense
    • About Sightline Cyberfraud Defense
    • Getting Started
    • What's different in Sightline Cyberfraud Defense
    • Sensor changelog
    • About the Overview Dashboard
    • Glossary
  • AgenticTrust
    • Getting started with AgenticTrust
    • AI Agents Monitoring Dashboard
    • AI Visitors Overview Dashboard
    • Manage AI Agent Permissions
    • Agentic Activity Priority
    • Agent Trust Levels
  • Account Defender
    • Account Defender Overview
    • Use Cases
    • Prerequisites
    • Getting Started with Account Defender
    • Optimizing Account Defender Detection
    • Validating Account Defender Integration
    • Risk Triggers
    • About Network Events
    • Troubleshooting
  • Bot Defender
    • Bot Defender Overview
    • Detection
    • Bot Defender Policy Settings
      • Bot Characteristics
      • Investigate the Data
      • Data Export
    • Footprint
  • Credential Intelligence
    • Credential Intelligence Overview
    • How to Access the Breached Flag
    • Credential Intelligence FAQ
    • Credential Intelligence Dashboard
  • Code Defender
    • Code Defender Introduction
    • Getting Started with Code Defender
    • Code Defender Glossary
    • Website Risk Analyzer
  • Platform
    • Account settings
    • Manage users
    • Role permissions
    • Enforcer configurations
    • Page Type Mapping
  • Client-Side Integration
    • JavaScript tag
    • Improving first page performance
    • Use of cookies & web storage
    • Advanced client integration
LogoLogo
Login
Login
HUMAN DashboardHUMAN WebsiteRequest a Demo
On this page
  • Deep-dive into specific traffic in the Dashboard
  • Incident Types
  • Investigation Time Range
  • Filters
  • Investigation Analyzer
  • Investigation Forensics (Activity Timeline)
  • Search
Bot DefenderReporting and Analysis

Investigate the Data

Was this page helpful?
Previous

Data Export

Next
Built with

Deep-dive into specific traffic in the Dashboard

The Investigation page is made up of two correlating tabs; Analyzer and Forensics. The Analyzer tab presents detailed search results and insights into traffic sources. The Forensics tab presents the Activity Timeline, a raw data table relevant to the search parameters.

The Investigation toggle allows you to navigate between the the Analyzer and Forensics tabs.

Incident Types

Type IDNameDescription
12UI AnomalyUser interface interaction is typical of non-human users
13Denied ServiceOne or more of the client’s properties was denied
14Custom DenylistThe request was denied because of a customer defined rule
15Cloud ServiceThe request was detected as a cloud service
16Anonymizing ServiceRequest originates from a Cloud Provider, VPN, Anonymizing Proxy or spoofed IP
17Bot BehaviorBehavioral patterns deviate from typical human activity
18SpoofThe detected browser does not match the declared browser
19Predictive AnalyticsAnomalies in behavioral data relevant for the request
20Automation ToolRequest properties indicate the use of an automation tool
21Bad ReputationIn the past, users with the same properties performed malicious activities
22Volumetric RuleActivity exceeded volumetric policy definition
23Missing Sensor DataJS Sensor information was not sent
24Allowed Volume ExceededRequest volume anomaly detected
25Captcha Solving AttackIndications of a CAPTCHA solving attack such as solving farms and solving automation

Investigation Time Range

When the Investigation page is opened independent of a Search, all of the account data is presented for the Time Range selected.

If the Time Range applied to the search is more than 14 days, the last 14 days of data is presented.

Filters

The filters in the Investigation page allow users to fine-tune the data presented. The filters in the Investigation page are the same filters as in the Dashboard_, but apart from the Time Range and the Applications selected do not carry over from the Dashboard during a search. The filters affect all data in the Investigation page.

Investigation Analyzer

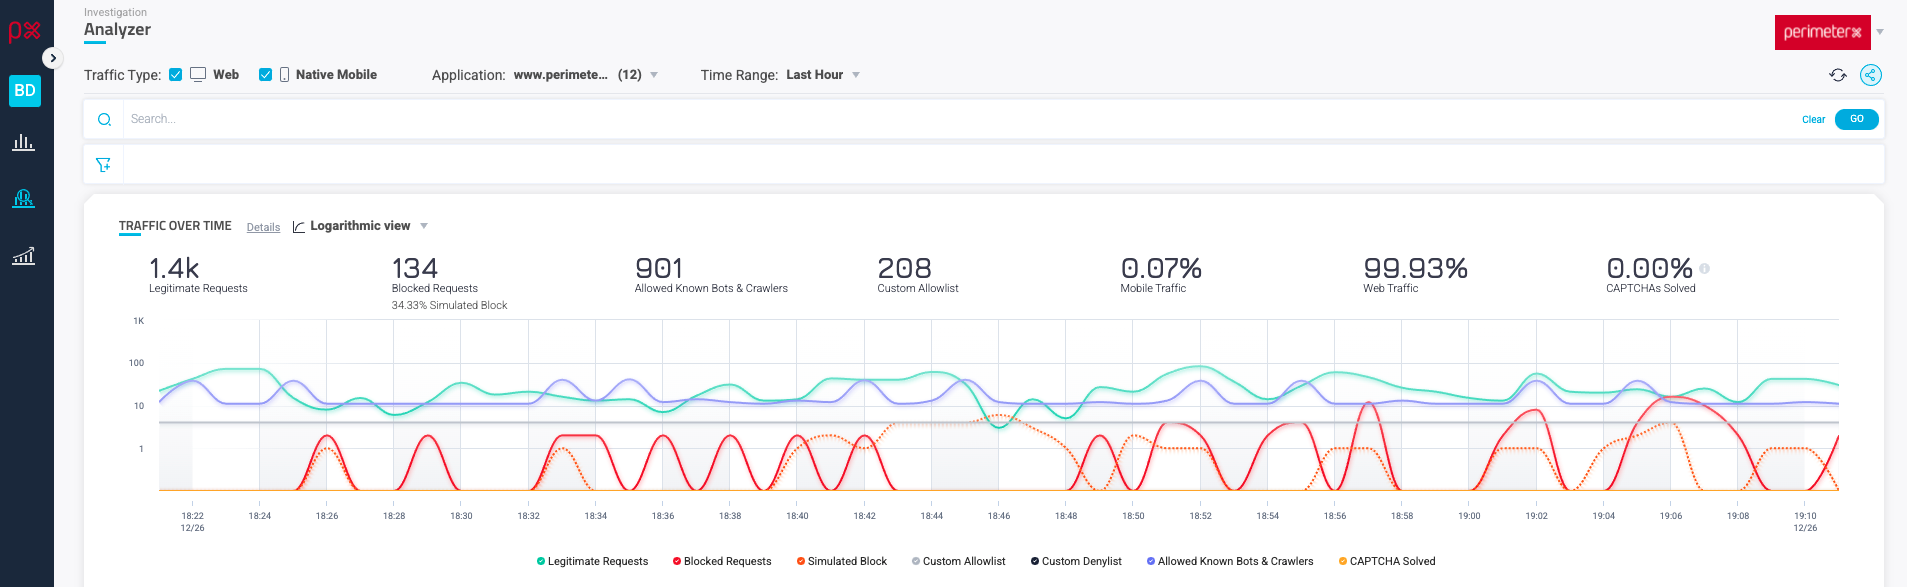
The data generated by the search is presented in the Analyzer tab. A breakdown of all traffic sources contributing to the total percentage are listed.

Included in the Analyzer tab are the following components:

  • Traffic Over Time
  • Incident Types
  • Top Countries
  • Cloud Vendors
  • Services IP Classification
  • Top Paths
  • Top 10 IPs
  • Top User Agents
  • Header Referrers
  • To 10 ASN Organizations

Also included in the Investigation tab is the Activity Timeline. This table presents the raw data used to create the components in the tab.

Investigation Forensics (Activity Timeline)

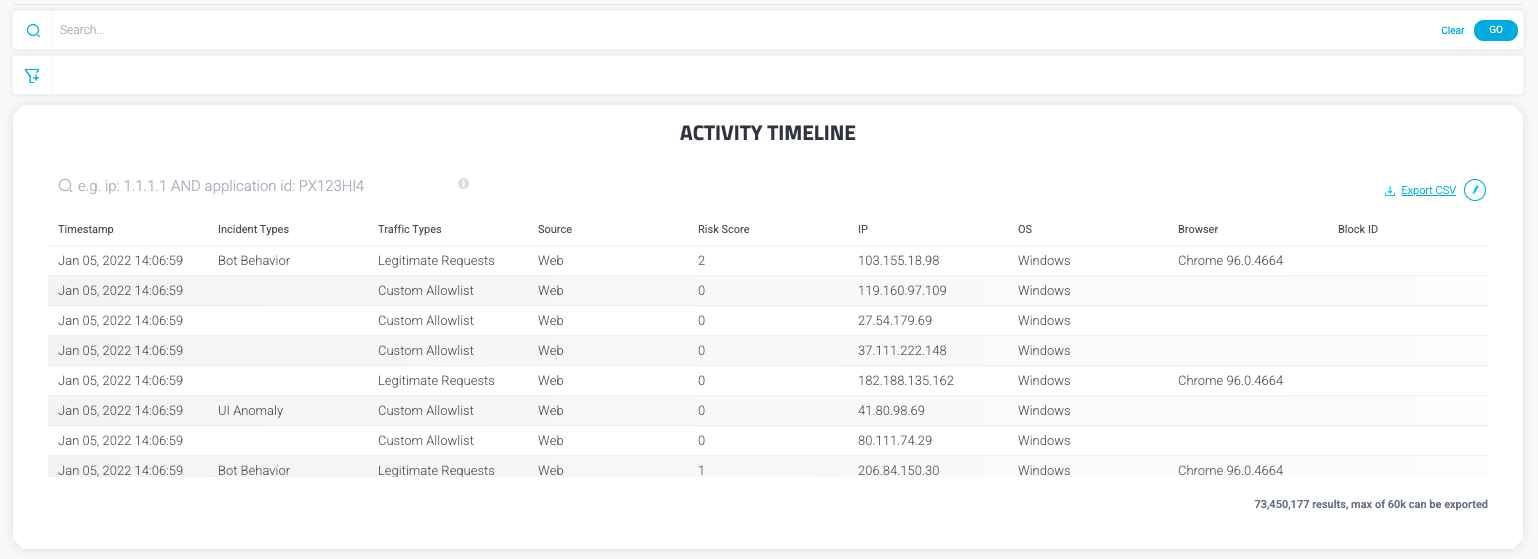
The raw data table is displayed in the Forensics tab. It allows users to investigate raw data relevant to the information presented in the Analyzer components. The data is subject to the applied filters and provides up to the most 60,000 recent requests.

Users can choose which data is presented in the table by adding or removing various columns. The table’s configuration is saved per user.

Search

The data in the Forensics table can be filtered per column(s) of interest.

Some tips for searching the Forensics table:

  • Enter the column name followed by : eg. Traffic Types:
  • There must be a space between the : and the value
  • Column names are not case sensitive
  • All operators can be used

Search example: Traffic type: Legitimate Requests AND (ip: 27.62.247.167 OR IP: 1.64.71.81)

Table data can be exported to a CSV file with a maximum of 60K rows.