Analyzer
The Code Defender Script Analyzer provides an in-depth analysis of individual scripts’ details, actions, and risk.
This feature provides a detailed view of all script actions. Every document object model (DOM) interaction, network and storage action of all scripts is readily available on the dashboard. The Analyzer dashboard also shows scripts that started, stopped or have ongoing actions on any given day, as well as script actions over time.
Analyzing a Script
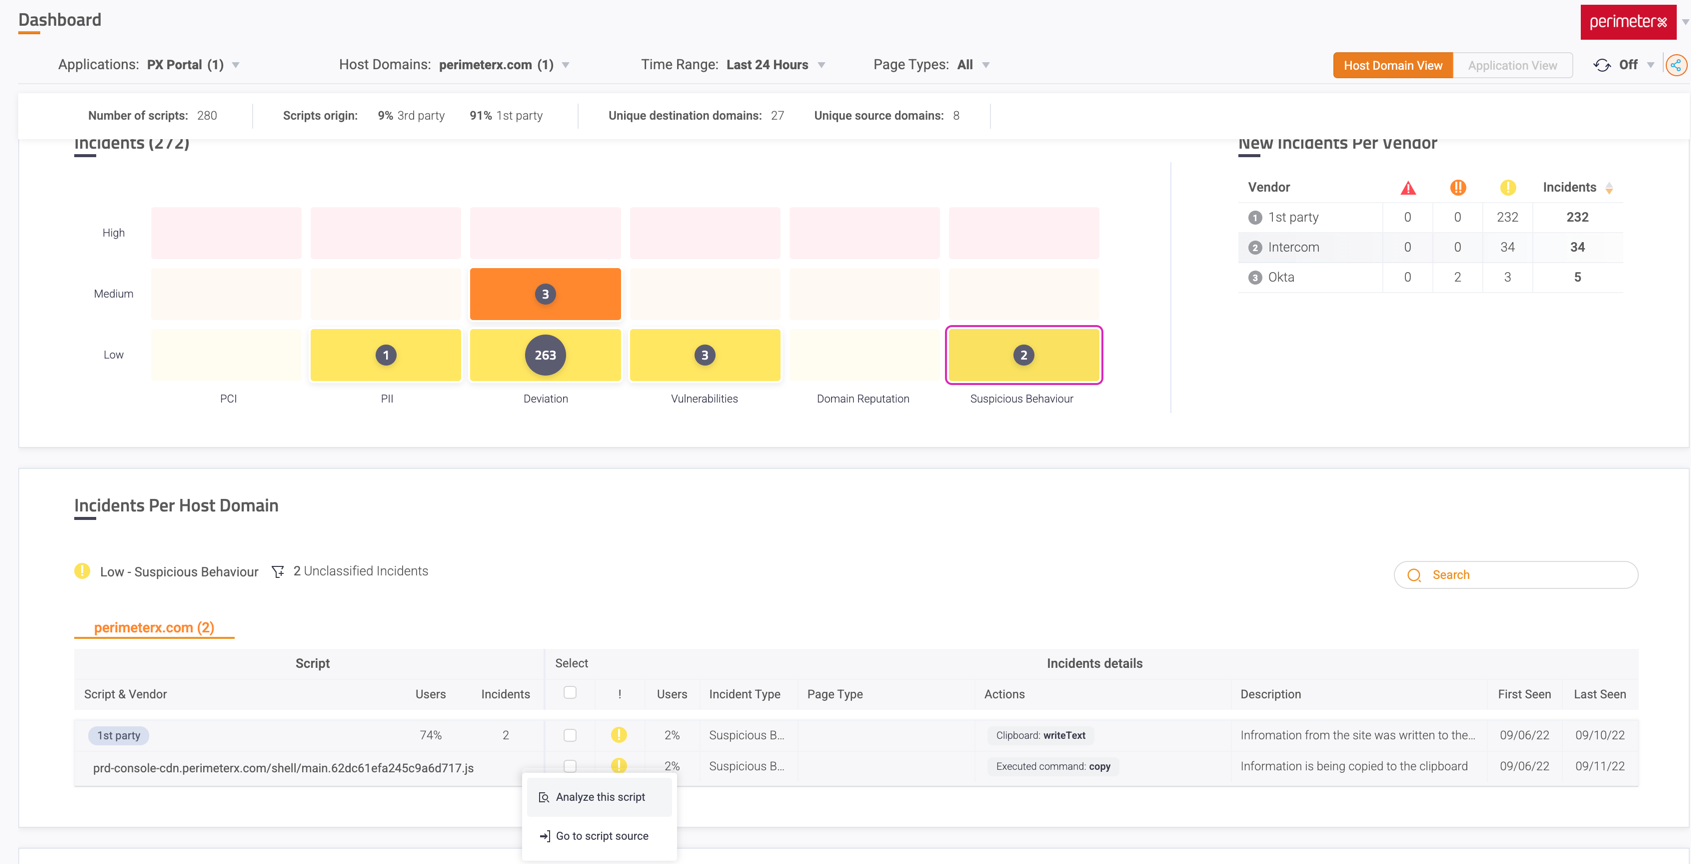
The Script Analyzer is accessed either by the left sidebar, or by clicking on any script ID or incident on the Dashboard and clicking Analyze this script. In the Analyzer page, you can search for a specific script or you can select any script from the searchbar. The list of scripts that appear in the dropdown corresponds to the filters selected in the Filters bar (selected application(s) + selected host domain(s)). Changing any of the filters changes the scripts presented in the dropdown list.
Analyzer searchbar
- On the sidebar, go to Analyzer.
- On the top panel, choose the application and the host domain where the script is loaded on.
- Search for the script by name in the search bar

Dropdown
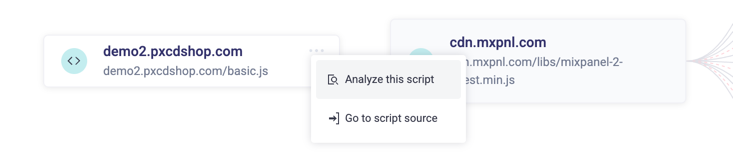
- On the dashboard, right-click on any script name or incident.
- From the context menu, choose Analyze this script.
- If the dashboard is on Application View, choose from which host domain to analyze the script (might be different between host domains).
Script information
The analyzer provides the following analyses:
- Analyzed Script & Incidents.
- Script Exposure
- URL Example
- Incidents
- Script Connections Map
- Script-External Domains Connections
- Script Actions Per Category
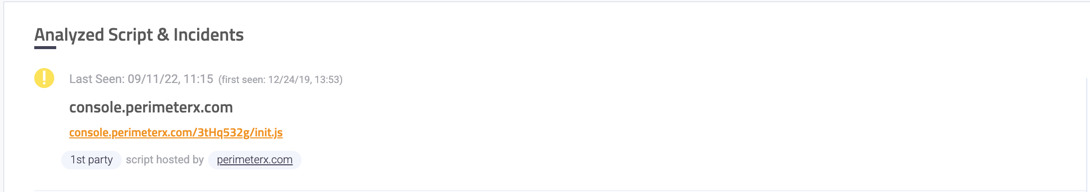
Analyzed Script & Incidents
General information about the script:
- Risk level - Marked with a logo - The script risk level is set by the highest incident risk related to the script.
- Last Seen - The date on which the script was last observed on the site
- First seen - The date on which the script was first observed on the site
- The script host domain - The domain on which the script is running. This link opens the vendor site in a new tab.
- Link to the script - A link to the script’s source. This link opens the vendor site in a new tab.
When a script has no associated vendor, you are prompted to input the vendor details.
Click Add missing info and fill in the relevant details in the ADD VENDOR dialog box. - Party - A tag that marks the script party (1st\3rd\inline)
- 1st party or Inline: script hosted by - The script’s vendor name (most likely, the customer’s domain)
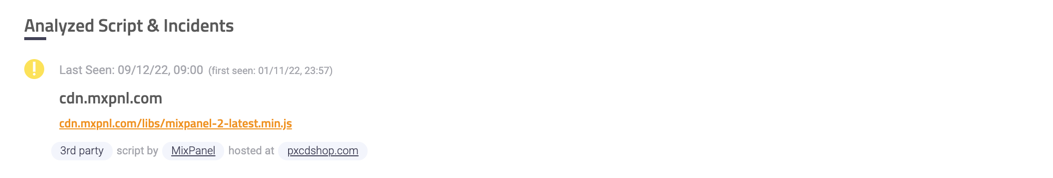
- 3rd party: script by - the script’s vendor name (link to the vendor’s website), hosted at - the domain hosting the script
1st party script:
3rd party script:
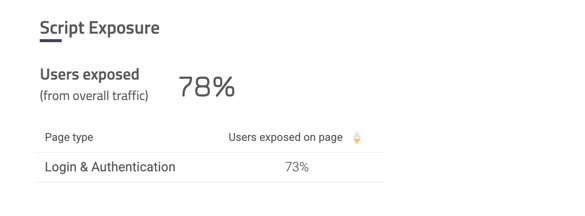
Script Exposure
The percentage of users affected by the script.
broken down by page type if available
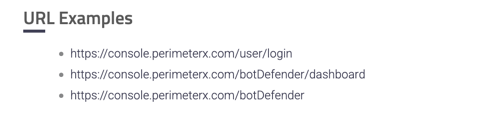
URL Example
Top 3 pages of your site where the script was frequently detected
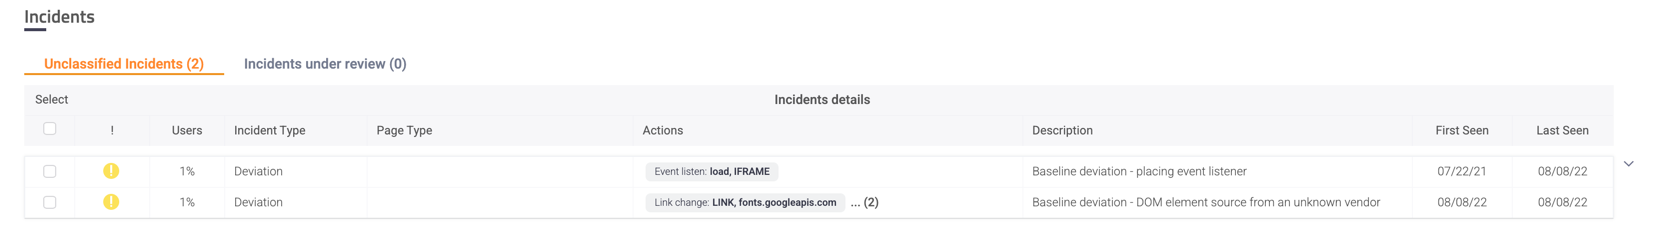
Incidents
All incidents triggered by the script’s action(s) from the last 3 months, grouped by “Unclassified” or “Under review”.
Expand the Incident to display the full list of actions or page types.
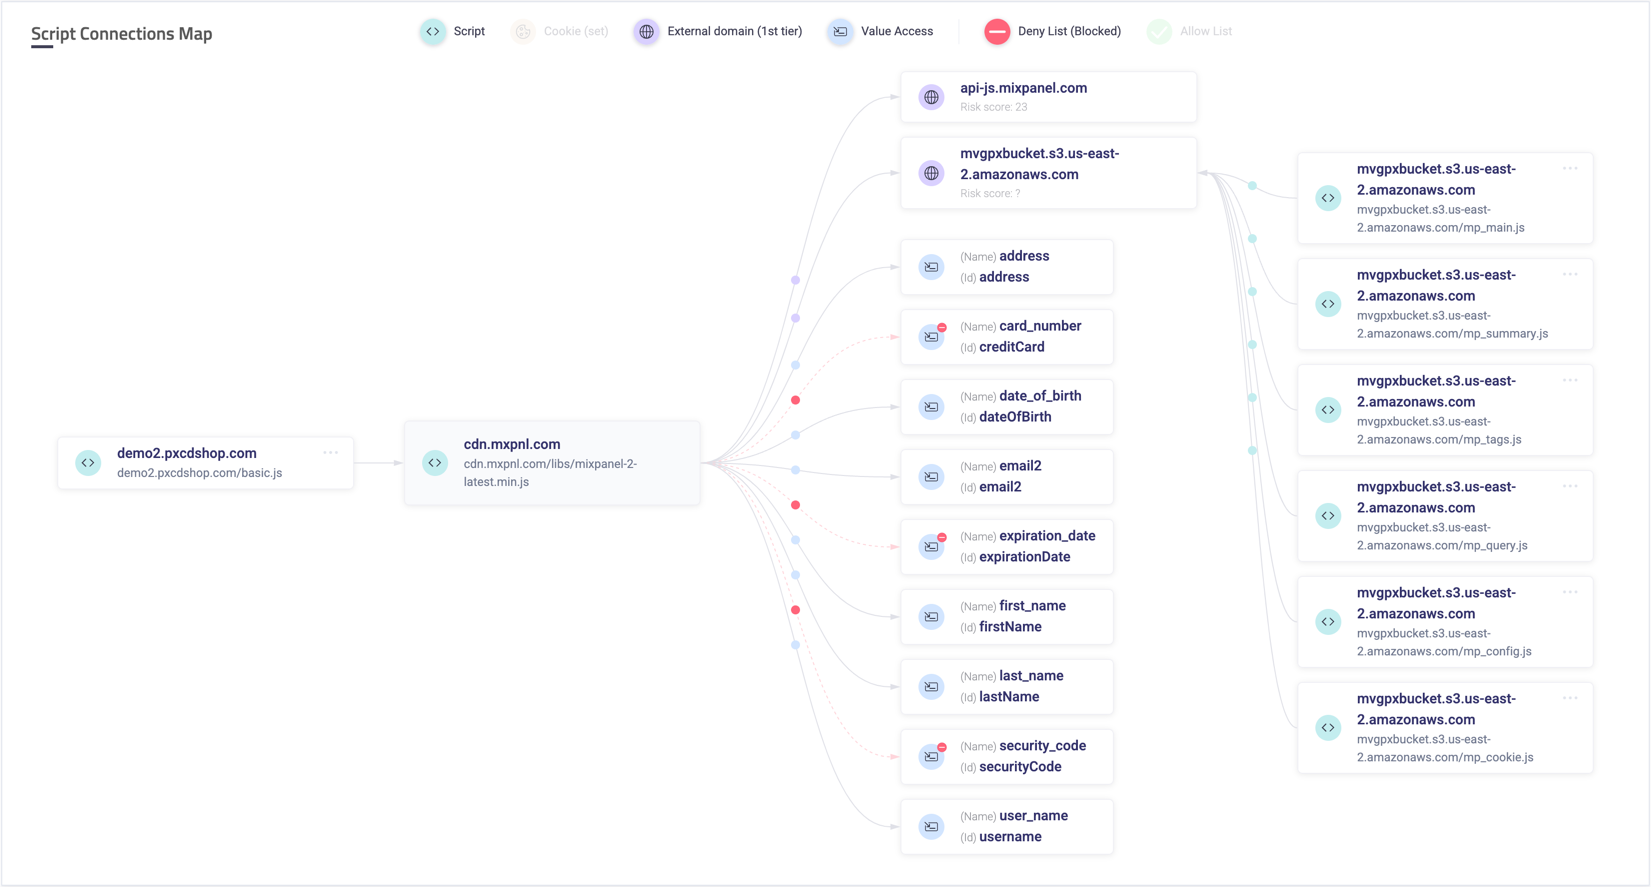
Script Connections Map
A showcase of the most important behavior of the script in a visual, concise manner: what cookies were set, what domains were being communicated with (and which scripts were fetched via these domains), as well as what element values were being accessed.
Any allowed or denied behaviors are reflected via a unique styling (green and red lines and icons, respectively).

When you hover over the colored dot on each line, a tooltip is displayed describing the connection (for example, “XHR, Beacon” when hovering over a connection to the domain that was communicated with using both an XHR and Beacon request).
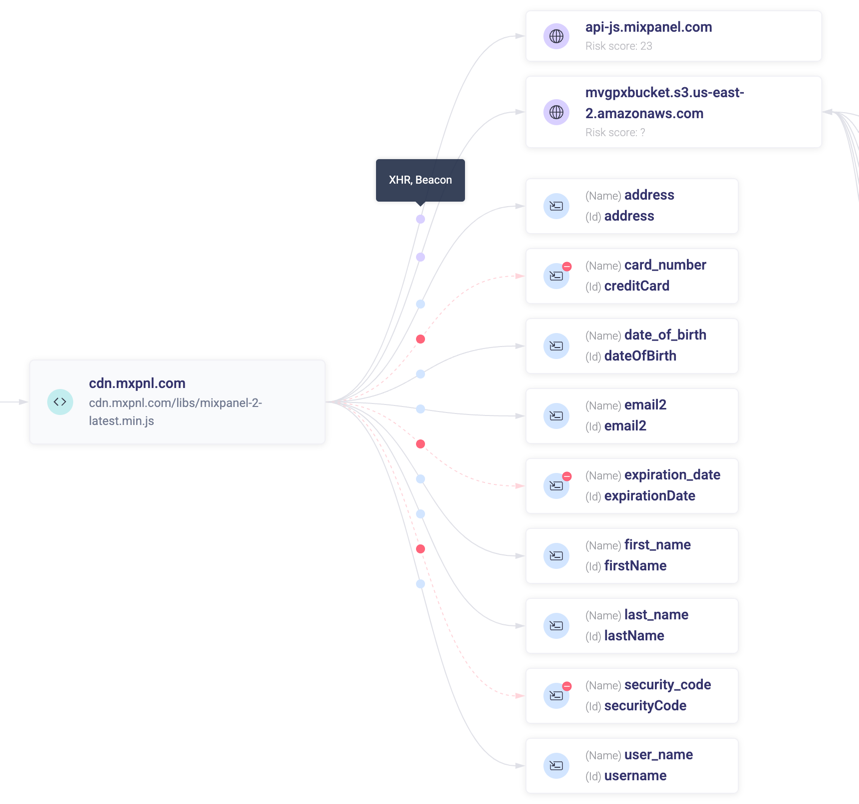
Visual data flow
The visual flow starts on the left (1st column) with the collection of scripts that loads the script that is currently being analyzed.
When this column is empty, this indicates that the analyzed script is loaded directly from the DOM.
The 2nd column represents the script currently being analyzed.
The 3rd column represents the actions performed by the analyzed script:
- Cookie set - All the cookies being set by the script
- External domains - All the domains the script is communicating with. Any scripts loaded from the analyzed script are shown on the right (4th column), directed at the domain they are loaded from (3rd column).
- Value access - All the input value fields which are being accessed by the script
Filtering the map
The entities on the map can be filtered out via the clickable legend on top.
For example, filtering out the ‘Set Cookie’ actions, as well as any allowed actions results in the following map:
Extending the analysis
The analysis process can be extended by inspecting any of the loading (1st column) or loaded-by scripts (4th column).
Clicking the More button in the top-right corner of any script entity opens a menu that allows to see the script’s source code or analyze it instead of the current one.
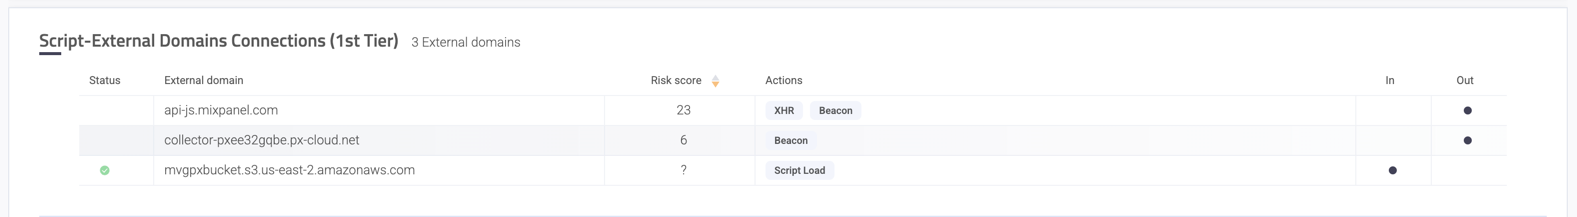
Script-External Domains Connections (1st tier)
A list of all the domains the script is communicating with. Each domain includes its status (allowed or denied, when applicable), risk score (aggregated risk level based on internal and external sources), the types of interactions (actions) that were observed (for example XHR, Fetch, IFrame Load, etc.), and whether the communication was in-bound or out-bound.
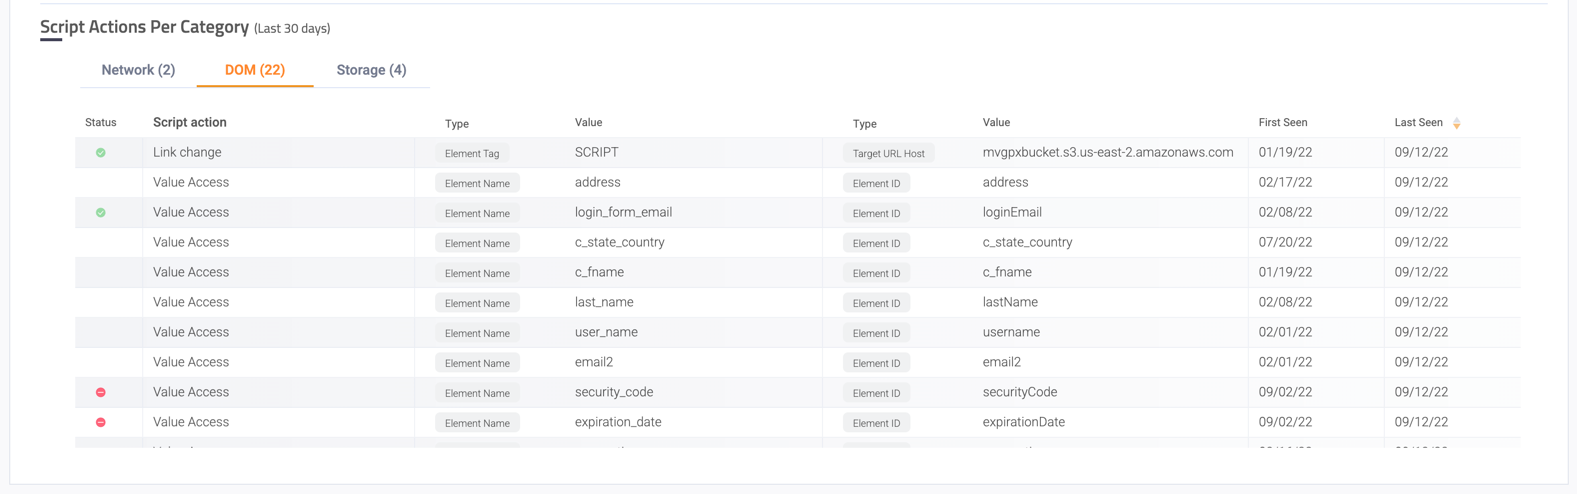
Script Actions Per Category
All the actions performed by the script in the last 30 days, broken down into 3 main category types: Network, DOM and Storage.
Each action includes its status (allowed or denied, when applicable) and the observed values with value type.