About the Block Rate Benchmark report
The Block Rate Benchmark report summarizes your attack rates per threat types in your applications over time, then compares these rates to other organizations in similar industries or in the Human Collective. This lets you appraise your applications’ attack rates against organizations similar to yours and determine if you need to adjust your mitigation rules.
HUMAN calculates the attack rate by the number of requests mitigated by HUMAN ÷ the total number of requests × 100. For example, if an application has 1,000,000 total requests and 20,000 mitigated requests, then the attack rate is 20,000 ÷ 1,000,000 × 100 = 2%.
You can access the report from Sightline Cyberfraud Defense > Explore > Reports > Block Rate Benchmark.
Filters
You can apply filters to refine the data that appears and customize the benchmark data to compare to. These filters apply to all the data that appears in the report.
![]()
There are a variety of filters available:
- Application: Filter by the applications you’ve created in HUMAN.
- Benchmark Comparable: Select a benchmark group to compare your data to. These are:
- Your organization’s industry, such as retail and e-commerce or finance. This option doesn’t appear if your organization’s industry benchmark data set is too small to compare to.
- The Human Collective
- Threat Type: The type of attack you want to view. These are:
- Account Takeover Defense
- Transaction Abuse Defense
- Scraping Defense
- Data Contamination Defense
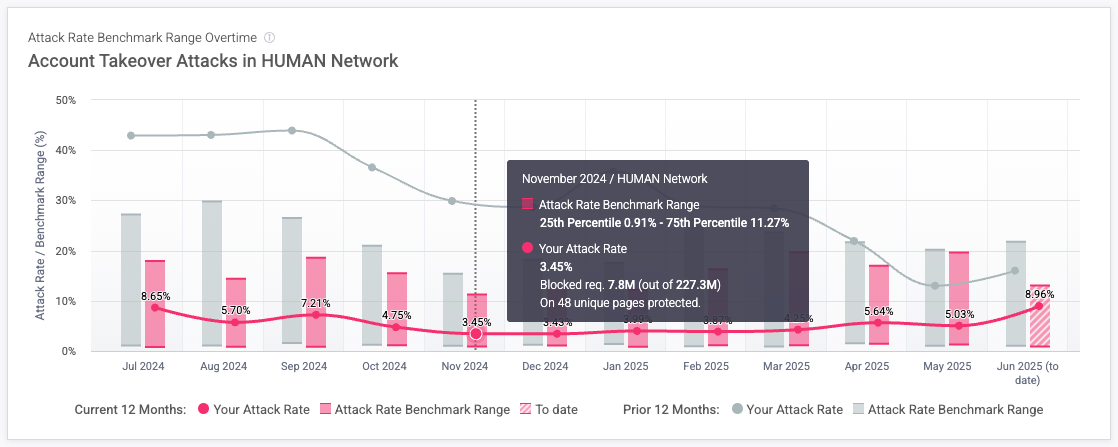
Attack Rate Benchmark Range Over Time
The Attack Rate Benchmark Range Over Time graph displays your attack rates from the past two years and compares them to attack rates from your selected benchmark comparable. This lets you view year-over-year trends in addition to tracking changes month-to-month. The colored areas represent data from the current year, while the gray areas are data from the previous year. Each bar represents the 25%-75% quartile block rate range for the benchmark comparable. In other words, the bar shows the middle 50% of the benchmark. Meanwhile, each data point represents your block rate for that month. You can hover over these areas to get detailed statistics.
Attack Rate Benchmarks table
The Attack Rate Benchmarks table shows the same data from the Attack Rate Benchmark Range Over Time graph in a table view. This lets you get a quick summary of your applications’ rates by month.
The table has the following columns:
- Month: The month and year the data in the row is from.
- Unique Paths: The number of paths that were protected that month for the selected threat type.
- Requests (M) Your Total Traffic: The total number of requests on your selected applications for that month in millions.
- Requests (M) Blocked by HUMAN: The number of requests that were identified as your selected threat type and mitigated by HUMAN in millions.
- Your Attack Rate (%): The rate of attacks for the selected threat type on the protected paths and selected applications. Calculated by the number of requests mitigated by HUMAN ÷ the total number of requests × 100.
- Attack Rate Benchmark Range (%): The range of attack rates for the selected benchmark comparison between the 25th and 75th quartiles, or the middle 50% of attack rates.
- 25th Percentile: The lower range for the selected benchmark’s attack rate.
- 75th Percentile: The upper range for the selected benchmark’s attack rate.
You can export a CSV file of this table by clicking the download ![]() button.
button.