About the Agentic Visibility Overview dashboard
The Agentic Visibility dashboard shows AI traffic and behavior on your application, including what tasks they attempt to perform and which routes they attempt to access. This is useful for determining how many of your visitors are AI, which AI agents are most prevalent, and what activities they tend to do. You can then adjust your application’s policy rules and permissions to allow certain agents or actions while blocking unwanted ones.
Prerequisites
Your Sensor version must be at least 10.3.8 or higher to collect data. See our installation instructions to learn how to update to the latest version.
Filters
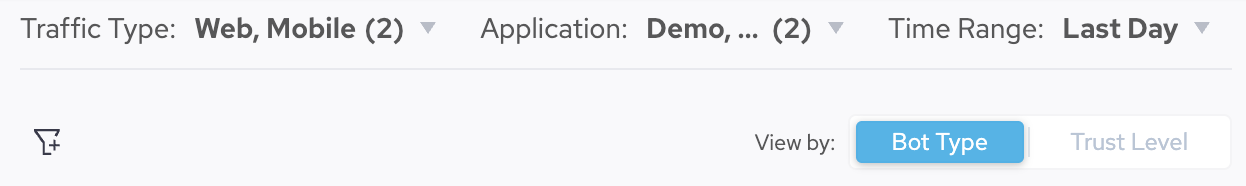
The Agentic Visibility dashboard has various filters that apply to the entire dashboard, including Traffic Over Time, Agentic Activity Distribution, and Bot & AI Agent Overview. Select filters from the available dropdown menus or the additional options in the filter menu. You can also toggle Traffic Over Time and Agentic Activity Distribution with different views.
Traffic Over Time
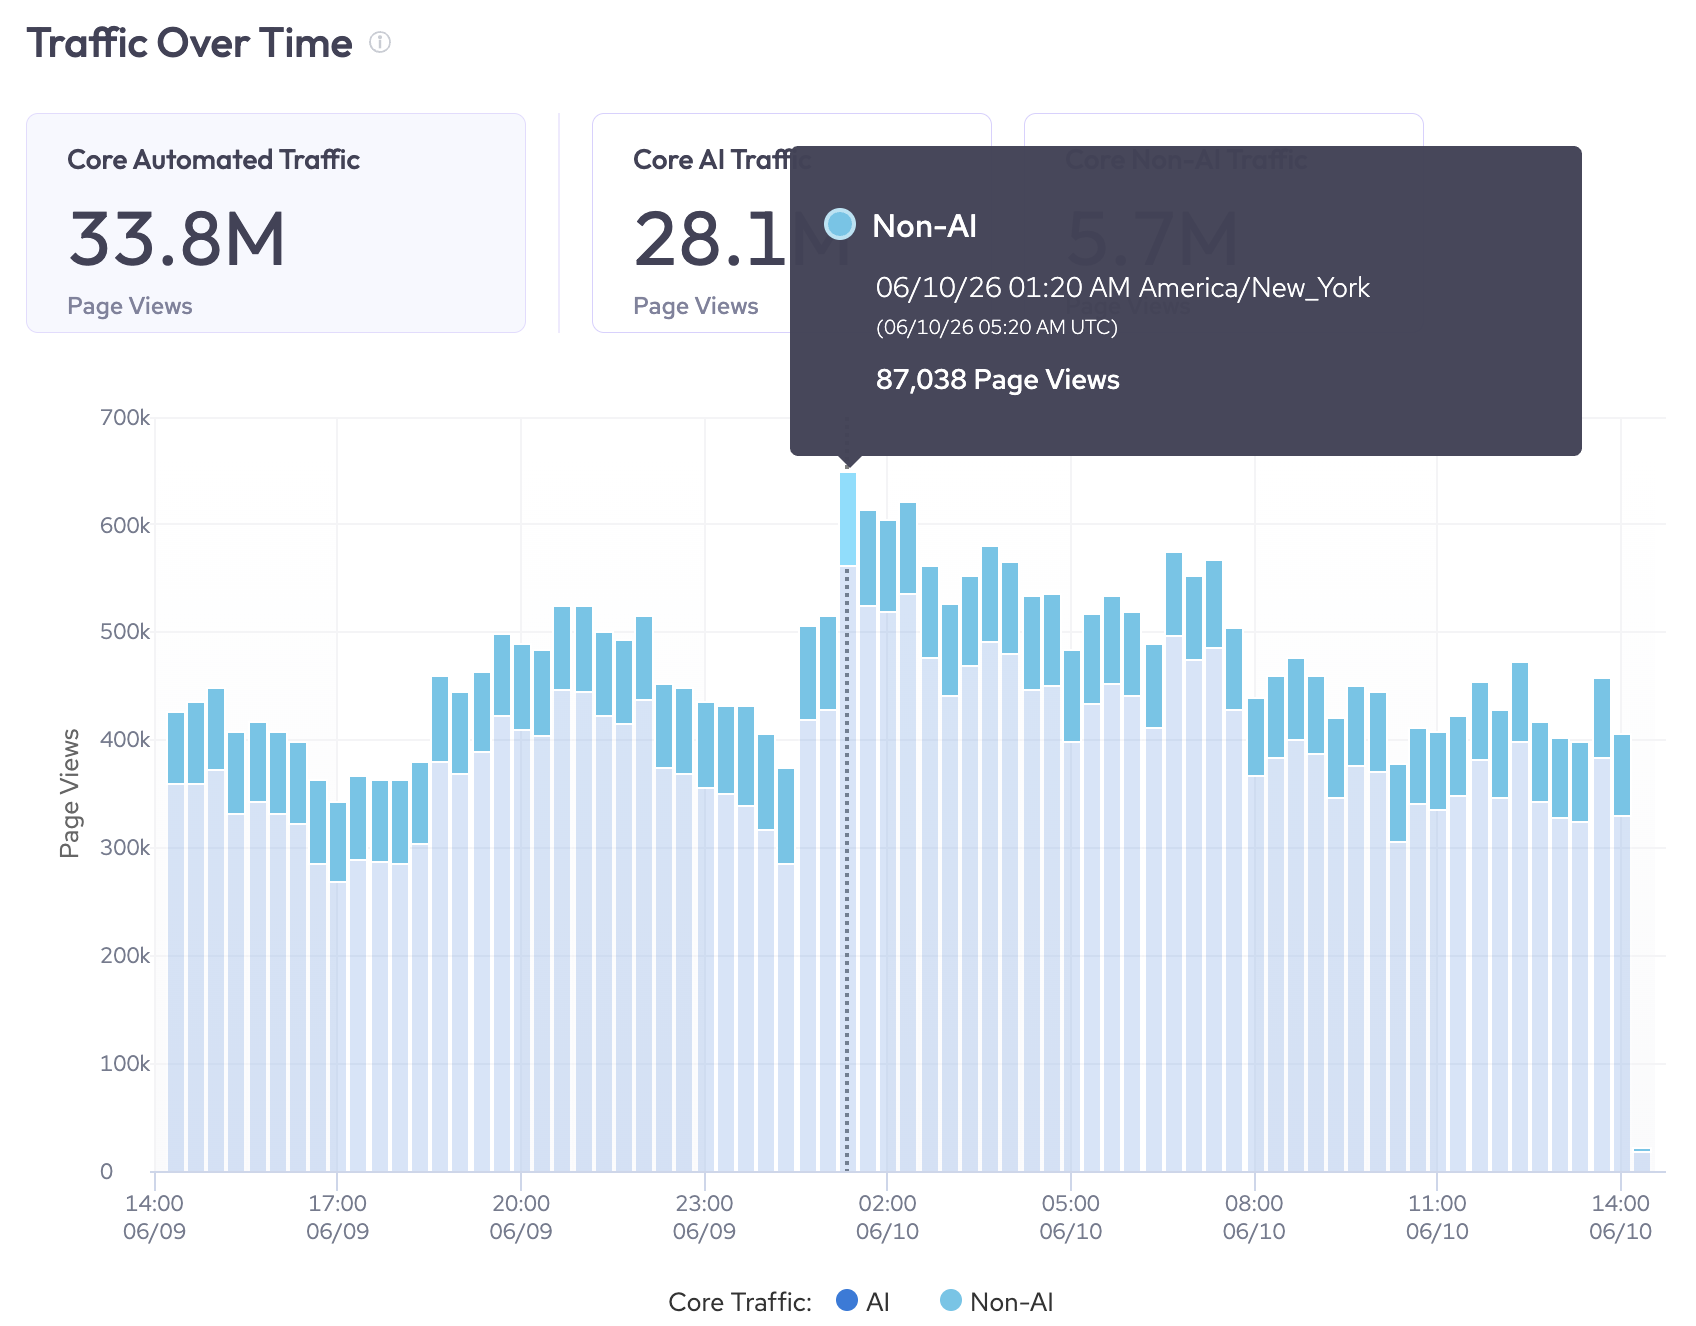
The Traffic Over Time graph shows AI traffic over the chosen period of time. This is useful for tracking the overall trend in AI activity over a certain time period, as well as for observing unusual spikes or dips in activity.
You can hover over any bar in the graph to show the precise number of page views for that category.
Bot Type view
The Bot Type view compares AI agent traffic with non-AI bot traffic over time. This helps you track the distribution of automated traffic on your application. This view has the following statistics:
- Automated Traffic: Traffic from automation, such as bots, that are programmatically generated.
- AI Traffic: Traffic from AI agents, bots, typically with real or simulated browser environments.
- Non-AI Traffic: Traffic that isn’t classified as being used or associated with AI.
Trust Level view
The Trust Level view shows the distribution of AI agents by Trust Level over time. This helps you determine how much of your agent traffic is from trusted agents and if you need to adjust your AI agent permissions to deter agents with low trust.
See About Agent Trust Levels for more details on how HUMAN assigns Trust Levels.
This view has the following statistics:
- Low Trust: The bot or agent is easily spoofable or associated with low-value activities like scraping.
- Medium Trust: The agent is semi-verified, partially declared, or stealth.
- High Trust: The agent is fully verified.
Agentic Activity Distribution
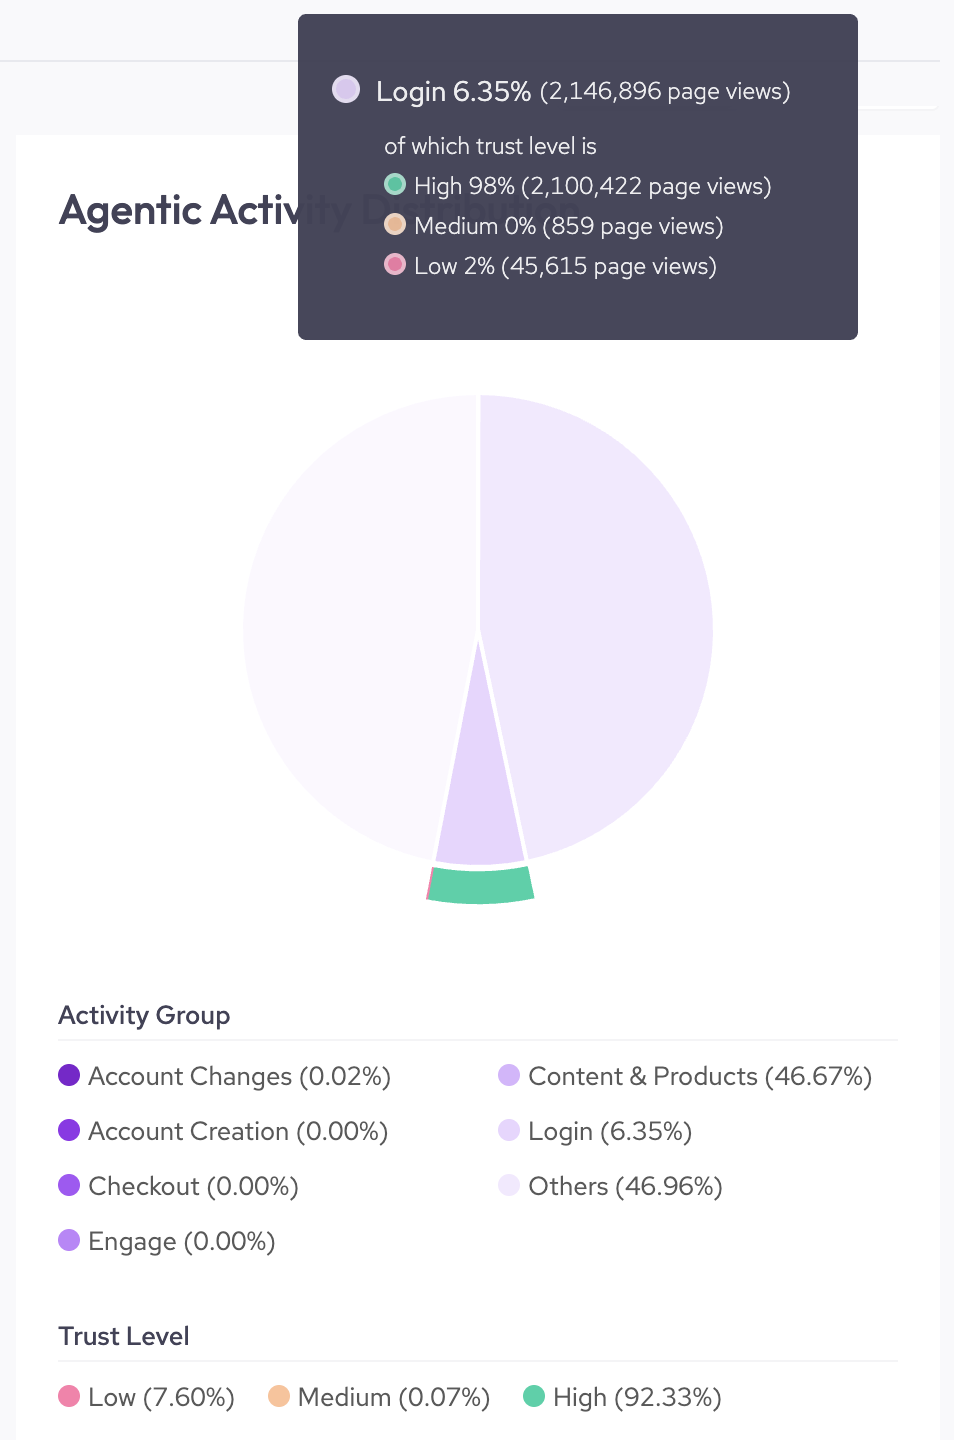
The Agentic Activity Distribution chart categorizes agents by activity group and trust over the selected time period. This helps you determine what tasks AI agents tend to perform on your site and, if the activities are sensitive or if there’s a strong distribution of low trust agents, to update your policies or permissions to deter them.
Bot Type view
The Bot Type view shows the distribution of AI agents by activity group. Each bot or AI agent can take part in multiple activities (for example, an agent might access a login page as well as the checkout page), so keep in mind that each visitor could be counted multiple times over different activity groups. For more information on each activity group, refer to the permission categories in Agentic activity priority.
You can also hover over a distribution to view a detailed breakdown of agents by trust level within that activity group.
Trust Level view
The Trust Level view shows the distribution of AI agents by Trust Level:
See About Agent Trust Levels for more details on how HUMAN assigns Trust Levels.
- Low Trust: The agent is easily spoofable.
- Medium Trust: The agent is semi-verified and partially declared.
- High Trust: The agent is fully verified and difficult to spoof.
Similarly to the Bot Type view, you can also hover over a distribution to view a detailed breakdown of agents by activity group within that Trust Level.
Bot & AI Agent Overview
You can find a list of all the AI Agents and bots HUMAN detected over the time period from the Bot & AI Agent Overview. This is useful for tracking which visitors are active on your applications and quickly identifying any new or unusual visitors.
- Agent Name, Provider, and Type: The name of the visitor, the visitor’s provider, and its bot type.
- Volume (page views): The total number of page views by the visitor over the time period.
- Trust: How trustworthy AgenticTrust considers this visitor. AgenticTrust calculates this based on how verified the visitor is as well as the spoofability of the agent. AgenticTrust measures Trust on three levels:
- High (H): The agent is fully verified and difficult to spoof.
- Medium (M): The agent is semi-verified and partially declared.
- Low (L): The agent is easily spoofable.
- Description: Information about the bot or agent’s intended use.
- Top Activity: The most common activity group the visitor participated in over the time period.
- Top Targeted Route: The most common route the agent was active on over the time period.
You can search for a specific agent in the table or click on an agent to open its Bot or Agent Details.
Bot or Agent Details
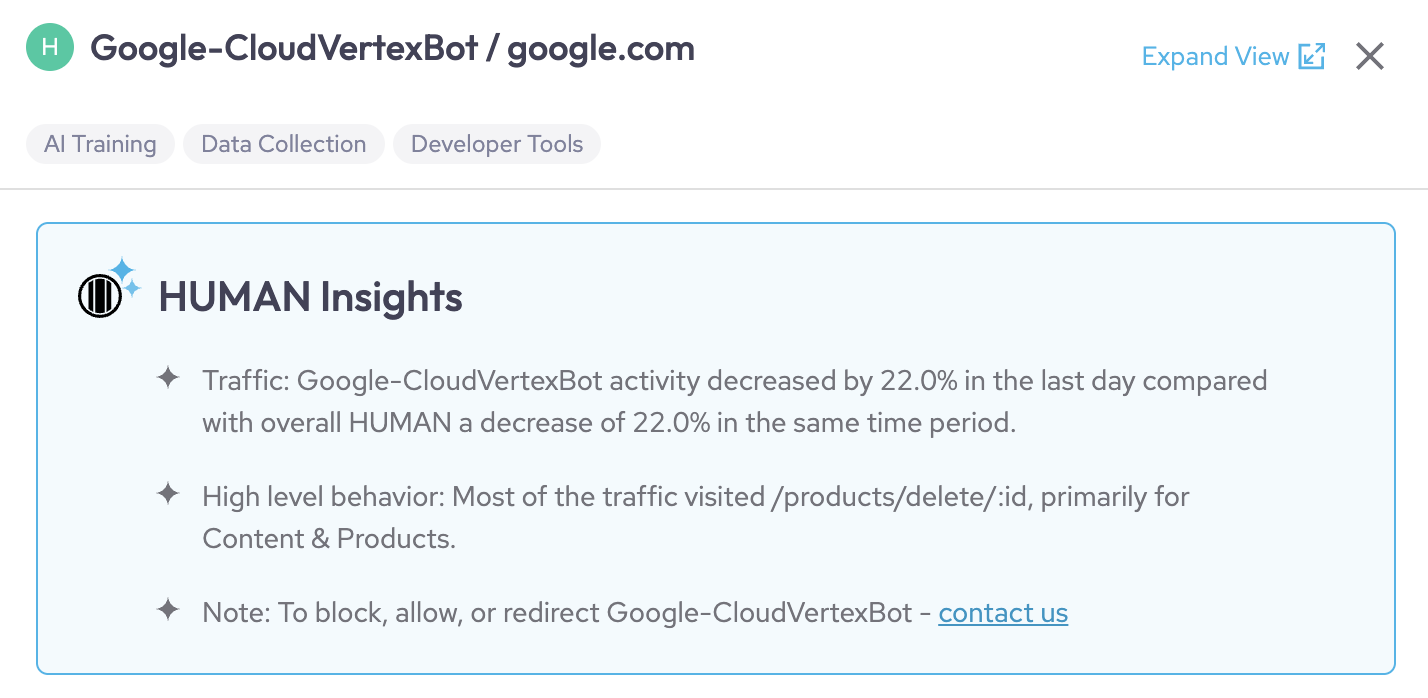
You can open the Bot or Agent Details view by clicking on a visitor from the Bot & AI Agent Overview. This provides a more in-depth view of the visitor’s activity. This is particularly useful for learning more about a visitor and investigating its behavior.
Each bot or agent has a summary with basic information and HUMAN Insights about its activity. You can reference these to make quick assessments about what the bot or agent was doing and if its activity is harmful.
General Information
The General Information tab lists basic information about the bot or agent, including its name, service provider, and a description of its intended use.
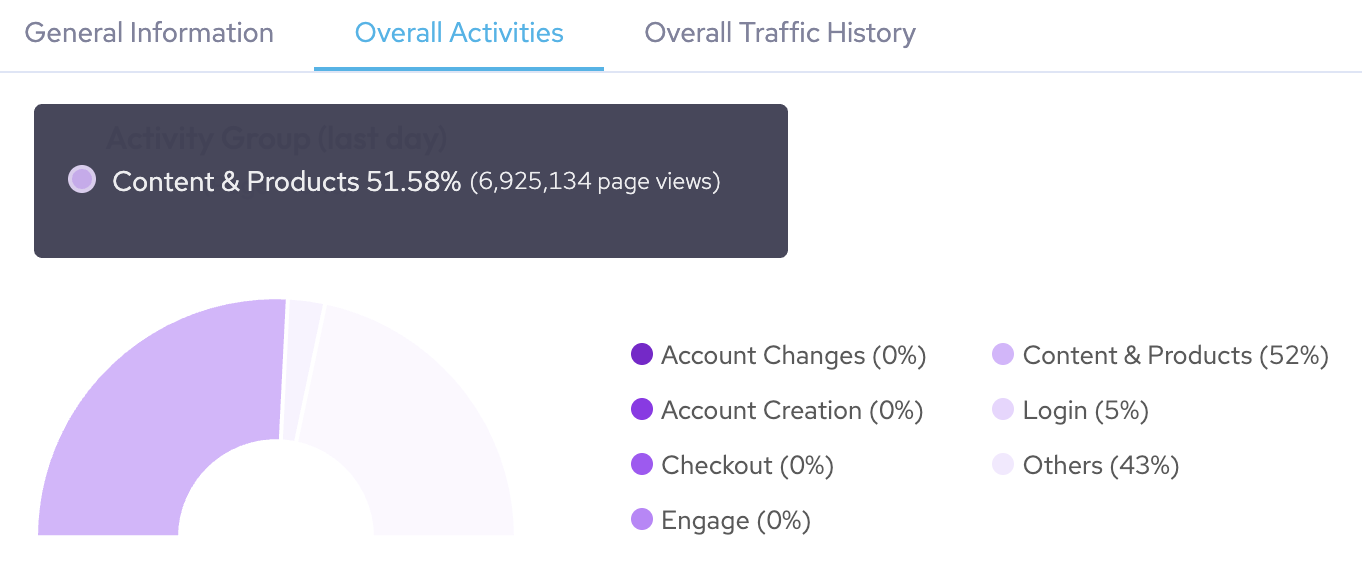
Overall Activities
The Overall Activities tab shows a distribution of all the activities this bot or agent participated in over the selected time period. This is useful for tracking a specific visitor’s activity and determining if their activity meets your expectations. If it doesn’t, then you may need to update your policy rules or agent permissions.
You can hover over each distribution to see the precise number of page views for that activity. See Agentic Activity Distribution for definitions of each activity group.
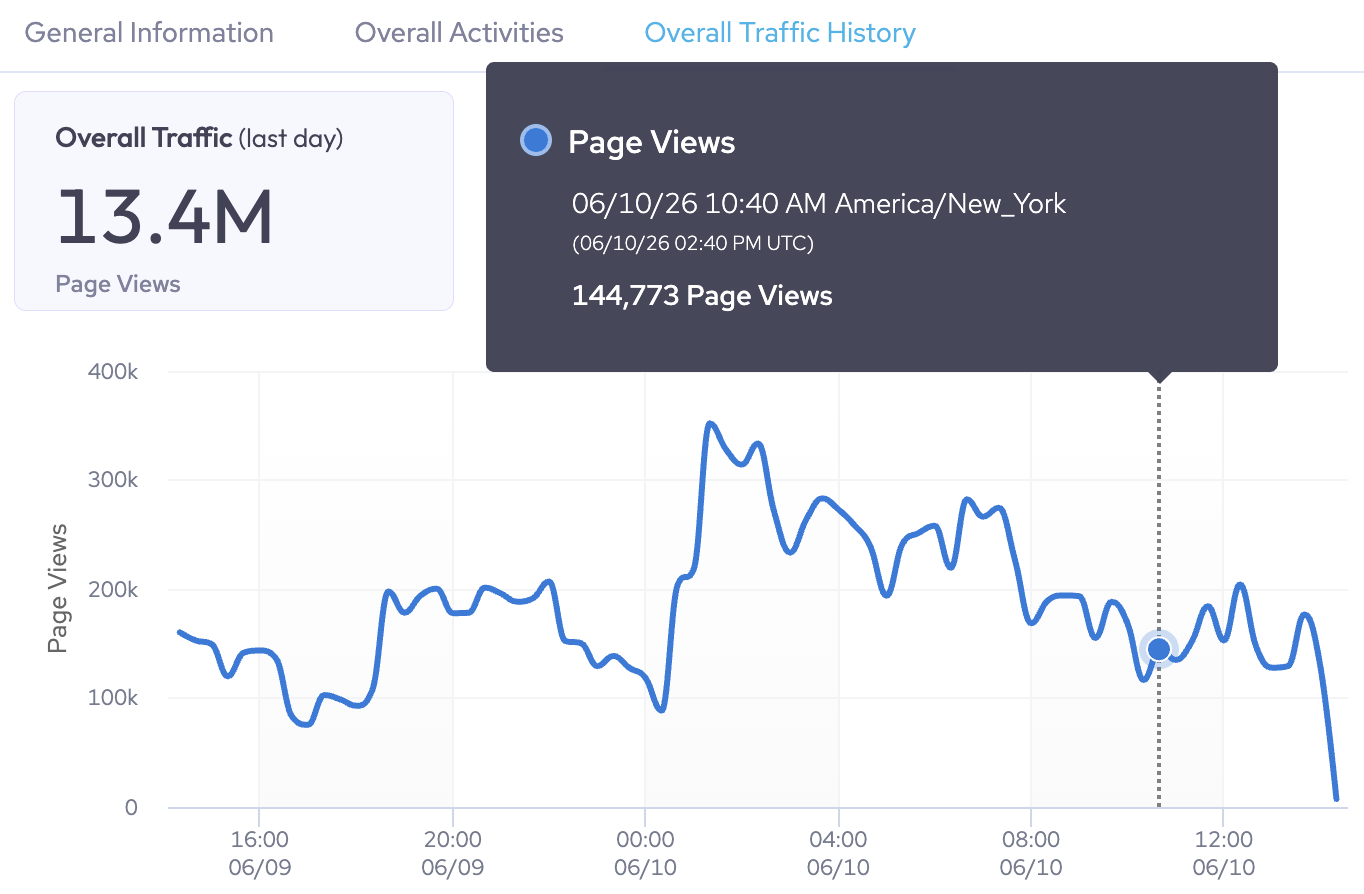
Overall Traffic History
The Overall Traffic History tab displays the visitor’s traffic history over the selected time range. It’s separated into two sections:
Overall Traffic
Overall Traffic shows the total number of page views for this visitor over the time period and displays a graph of its page views over time.
You can hover over a point in the graph to see the precise number of page views at that time.
Traffic Insights
Traffic Insights lists common traffic information for this visitor, including:
- Routes: The routes the visitor visited, organized by the number of requests per route. This is useful for identifying routes that visitors typically visit as well as spotting if this visitor visited any routes that they shouldn’t. Routes are groups of similar paths that refer to the same page, but may have a unique ID. These IDs are replaced with a variable in AgenticTrust. For example, login paths that use unique IDs might be grouped together in a single route like /products/:id.
- ASNs: The most prevalent autonomous system numbers (ASNs) that the visitor originated from.
- Referrers: The most prevalent referrers that visitors came from.
- Regions: The most prevalent regions that traffic originated from. Regions are indicated by country ISO codes.
You can hover over an insight to copy it to your clipboard.