About the Precheck Activity Overview dashboard
The Precheck Impact dashboard lets you review the impact Precheck has had on your application’s traffic. You can assess the total amount of traffic Precheck protected as well as detailed information about the traffic it blocked, such as the most common routes it blocked on.
You can learn more about the Precheck Impact dashboard with this article.
Prerequisites
Precheck needs to be enabled for data to appear. See Manage Precheck Settings for more information.
Filters
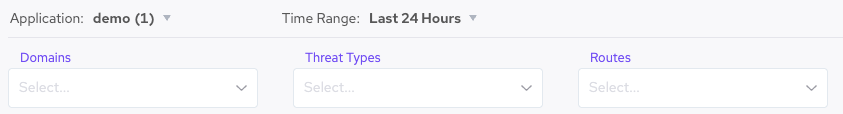
You can filter the dashboard with the following.
- Application: The applications you want to show data for. Each application needs to have Precheck enabled on it for its data to show.
- Time Range: The time range you want to show data for. This also affects any Previous Period data, which compares data from the current time period to data from the same amount of time before that period. For example, when looking at 24 hours of traffic, the dashboard will compare to the previous 24 hours. Similarly, when looking at 14 days of traffic, the dashboard will compare to the previous 14 days.
- Domains: The domains to show data for. Listed domains are from your selected Applications.
- Threat Types: The types of threats to show data for. These include Account Takeover (ATO), Fake Accounts (FA), Scraping (SCR), or Transaction Abuse (TXA).
- Routes: The routes to show data for. These are determined by your selected Applications, Domains, and Threat Types. Only Precheck-enabled routes will appear here.
Precheck Overtime
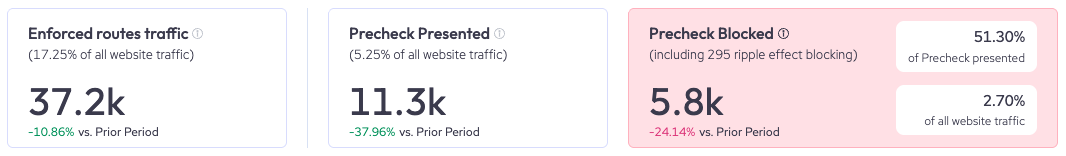
Precheck Overtime has statistics summarizing Precheck’s performance based on your selected filters. These are a great way to quickly learn how Precheck has protected your applications at a glance.
- Precheck Enforced Routes: The amount of traffic Precheck targets overall, or all traffic on routes that you enabled Precheck on. This does not include traffic from excluded routes.
- Precheck Presented: The number of requests that triggered Precheck due to lack of cookies.
- Precheck Blocked: The number of requests blocked by Precheck. This number includes ripple effect blocks, which refer to traffic blocked due to Precheck action that triggered the collection of additional signals. This means that Precheck did not block the request immediately, but ensured it will be caught later on by the detection mechanism.
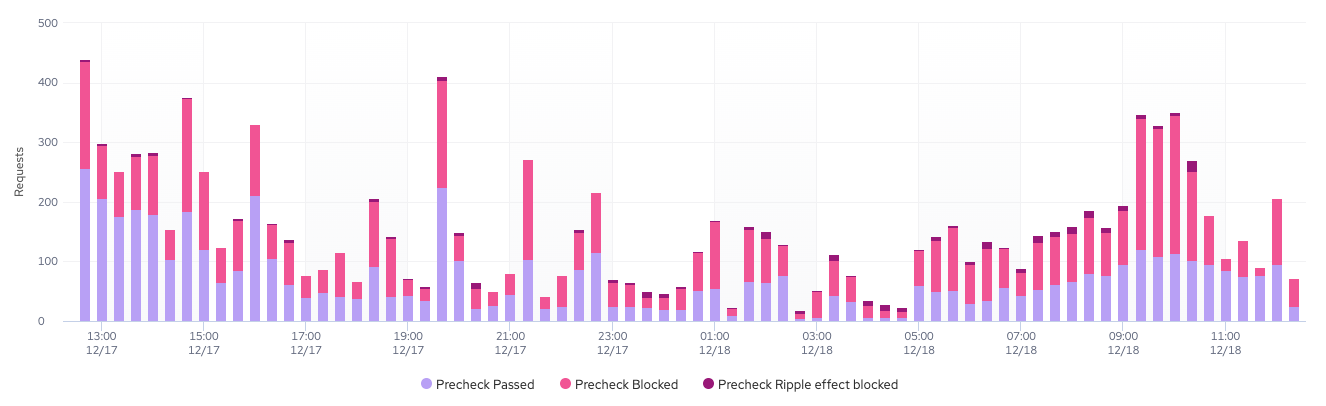
You can also see a breakdown of Precheck traffic over time with the bar graph. This shows the total amount of traffic Precheck targeted over the selected time period and compares blocked and ripple effect blocks.
Top 100s
Top 100s shows the most common information shared by blocked traffic based on your filters such as the common routes requests were on or which ASNs or countries the requests came from. This helps you learn more about potentially malicious traffic visiting your application.
You can scroll through all 100 entries using the scroll arrows « » and download each list as a CSV file. Each table can show any of the following:
- Total Route Traffic: Unique for Top Routes. Shows the total number of requests on the route.
- Precheck Presented (Requests): The number of requests Precheck presented on.
- Blocked (Requests): The number of requests Precheck blocked.
- Blocked (% of Presented): The percentage of all requests that Precheck presented on that it blocked.
- Blocked (% of Total Route Traffic): Unique for Top Routes. The percentage of all route traffic that Precheck presented on that it blocked.