About the Paid Traffic Insights dashboard
Invalid traffic (IVT) refers to when bot or non-human activities are involved in generating traffic in your paid traffic campaigns. Since IVT can inflate ad impressions or skew data, it’s important to track and mitigate it wherever possible. The Paid Traffic Insights dashboard displays in-depth information about IVT over time, including the number of blocked requests, incident types, and top forensics Sightline detected. This helps you gain a better understanding of when your observed IVT was active, what it was doing, and where it came from.
You can find this dashboard from Sightline Cyberfraud Defense > Explore > Traffic > Paid Traffic Insights. This article defines the data you can find in the dashboard. For more information on IVT and paid traffic over time, see About the Paid Traffic Trends dashboard.
Filters
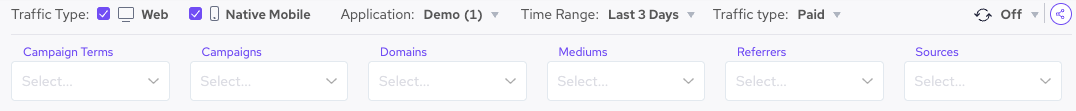
You can apply filters to refine the data shown. Filters apply to all components in the dashboard. You can filter by default Sightline filters such as Traffic Type or Application as well as by IVT forensics like Campaign Terms or Campaigns.
Traffic over time & Top 10 incident types
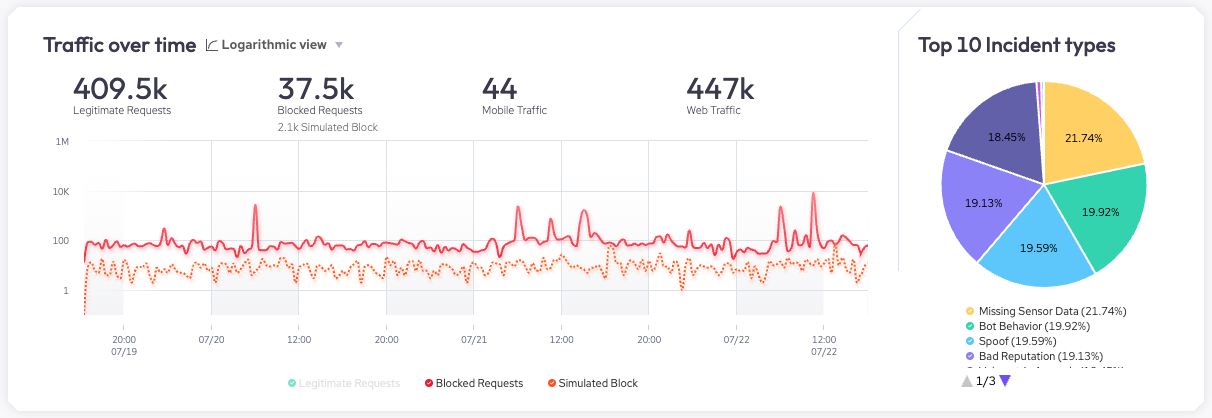
The Traffic over time graph shows your application’s requests over time. The top of the graph has overall statistics about your traffic, such as the total number of legitimate requests or blocked requests. You can use the graph itself to review legitimate and blocked requests over time. This is useful for tracking your traffic and identifying trends that may be worth investigating. You can click on each request type at the bottom of the graph to add or remove it from view.
The Top 10 incident types chart shows the distribution of incident types Sightline detected in your blocked requests. This is useful for identifying the type of malicious activity that occurred. You can hover over each type of incident or refer to the legend to see the specific percentage values for each incident type. You can view all our available incident types with our help article.
Top 100 by IVT
The Top 100 by IVT section lists the top 100 most common items Sightline detected in the IVT per identifier type. These lists help you learn about different characteristics about your IVT. For example, it might be useful to learn where IVT primarily comes from with the Referrers list. Or, it may be interesting to learn which of your Campaigns had the most IVT.
You can sort each list in ascending ![]() or descending
or descending ![]() order of Total IVT or IVT (%) and download
order of Total IVT or IVT (%) and download ![]() each list as a CSV file. You can also click on an individual list item to filter by it. Sightline exposes the following identifiers:
each list as a CSV file. You can also click on an individual list item to filter by it. Sightline exposes the following identifiers:
- Sources: Where the IVT came from. This is useful for pinpointing sources that are generating high amounts of IVT.
- Mediums: The method by which IVT arrived at your site such as cost-per-click (cpc) or organic. This is useful for identifying which mediums are more prone to IVT.
- Campaigns: The ID names of your paid traffic campaigns that had IVT. This is useful for identifying your campaigns with IVT and adjusting accordingly.
- Campaign Terms: The keywords or search queries that triggered your ads and had IVT. This is useful for identifying common search terms that have disproportionate amounts of IVT.
- Referrers: The URL of the webpage the IVT came from just before arriving at your site. This is useful for identifying any specific types of pages or sites that have disproportionate amounts of IVT.
- Domains: The publisher domain where your ad was shown and subsequently engaged by IVT. This is useful for identifying domains with disproportionate and consistent amounts of IVT.
- User Agents: The visitor’s user agent. This is useful for tracking user agent anomalies and identifying unusual user agent patterns that may indicate IVT.
- Known Bots: Legitimate bots that engaged in your paid traffic ads. This is useful for filtering out IVT from legitimate bot requests from your analytics and focusing on the remaining requests from illegitimate bots.