About Attack Profiles
HUMAN Sightline and the Sightline Dashboard features Attack Profiles, which are what HUMAN believes to be the individual attackers behind your bot attacks based on similar traits amongst all traffic. Attack Profiles are a secondary detection tool that help you isolate and explore interesting activity after the initial block happens. This lets you easily identify, understand, and monitor your traffic as the HUMAN Sightline model learns over time.
You can learn more about Attack Profiles and the information they provide in this article. See our articles on the Sightline Dashboard or Understanding Sightline Dashboard activity to learn more about what you can achieve with HUMAN Sightline.
About Attack Profiles
Attack Profiles are a tool to help you visualize groups of bot requests with similar indicators. HUMAN Sightline shares these indicators so you learn more about the individual attacker behind those requests. For example, with the information Attack Profiles provide, you can answer questions like:
- What were attackers trying to do?
- Where were the attackers coming from?
- Why were these identified as bots in the first place?
HUMAN Sightline creates Attack Profiles after it analyzes each instance of your incoming traffic with all other incoming traffic and compares incoming traffic with all historic traffic. During this analysis, HUMAN looks for common attributes amongst all this traffic. Based on those commonalities, HUMAN Sightline generates Attack Profiles that we believe are the individuals behind those similar bot requests. After HUMAN Sightline creates Attack Profiles, it constantly monitors new and past bot traffic to continuously assign similar traffic to existing Profiles or generate new ones.
For example, certain scraping attacks may be from one specific region, while other account takeover attacks may be particularly prevalent on specific routes. Based on those common factors, HUMAN Sightline may create two separate Attack Profiles, SCR-12AB34 and ATO-CD56EF. Then, any new traffic that has traits similar to either of those Profiles will be assigned to that Profile. However, if there’s new traffic that is markedly different, HUMAN Sightline may create a new Profile instead.
Keep in mind that this is a very simplified example. In reality, Attack Profiles are a result of rigorous statistical analysis and purpose-built AI that take into account many different variables, behaviors, and data for up to millions of requests at a time.
Signatures
Signatures are a certain group of traits that help HUMAN Sightline generate and assign traffic to an Attack Profile. By clicking on an Attack Profile from the Sightline Dashboard, you can open its Attack Profile Behaviors. This shows the number of signatures the model has associated with it so far.
Remember that signatures represent the number of individual traits the model has identified so far. You may encounter Attack Profiles with zero signatures, but this simply means the model is still analyzing that Profile. It does not mean that HUMAN Sightline isn’t sure if the Attack Profile really has bot activity, since an Attack Profile is only created after traffic was blocked.
Generally, you should expect that new Profiles have fewer signatures. The total signatures will slowly increase the longer the Profile is active on the account.

Each signature is either:
- A common indicator used across HUMAN’s network to identify specific bots, or
- A unique indicator specific to the Profile that HUMAN Sightline identified and applied to improve detection and combat Profile adaptation
Examples include the use of certain command line tools such as cURL, timing, signals based on hashes or ordering of headers, and indicators based on the presence or value of specific client-side signals.
Unique indicators are especially useful when learning about Attack Profiles because as bots become more sophisticated, they have fewer obvious indicators so they can pass off as legitimate. Signatures demonstrate that the HUMAN Sightline model is continuously monitoring and learning about the traffic patterns on your application. As bots adapt their behaviors to attempt to bypass Bot Defender, HUMAN Sightline adapts with them, flagging these new behaviors as new signatures while still associating them with the original Profile.
Attack Profile Characteristics
Profile Characteristics show the distribution of bot activity indicators associated with the Attack Profile.

Bot Indicators
This area shows the distribution of bot behaviors that the Profile’s requests exhibited. In other words, this shows why requests were flagged as bots. Bot Indicators shows the top two most prevalent indicators for a Profile, and any remaining indicators are grouped in Other.
You can view a full list of available indicators in our article.
Bot Capabilities
This area shows the distribution of capabilities that the Profile’s requests exhibited. Bot Capabilities refer to how sophisticated the bots were. In other words, this area shows how these requests tried to act like humans. Bot Capabilities shows the top two most prevalent indicators for a Profile, and any remaining indicators are grouped in Other.
You can view a full list of available indicators in our article.
IP Origin
This area shows the distribution of IP addresses’ sources or environments that the Profile’s requests came from. Knowing where the bots came from can indicate how sophisticated they are or if this Profile’s requests are from a centralized area. IP Origin shows the top two most prevalent origins for a Profile, and any remaining origins are grouped in Other.
You can view a full list of available indicators in our article.
Regions
This area shows the top two most prevalent regions the Profile’s requests came from, with any remaining regions grouped in Other. Regions are indicated by country ISO codes.
It also shows how many autonomous system numbers (ASNs) and regions the bots came from. Higher numbers typically indicate that the bots that made the requests are more sophisticated and trying to act more like humans. However, this doesn’t necessarily mean Profiles with low numbers aren’t sophisticated. For example, bots that use residential IPs, or Residential IP Usage, tend to be more sophisticated. In that case, you’d also expect that the number of regions is low, because that type of traffic typically is concentrated from the U.S.
Attack Profile Distribution Insights
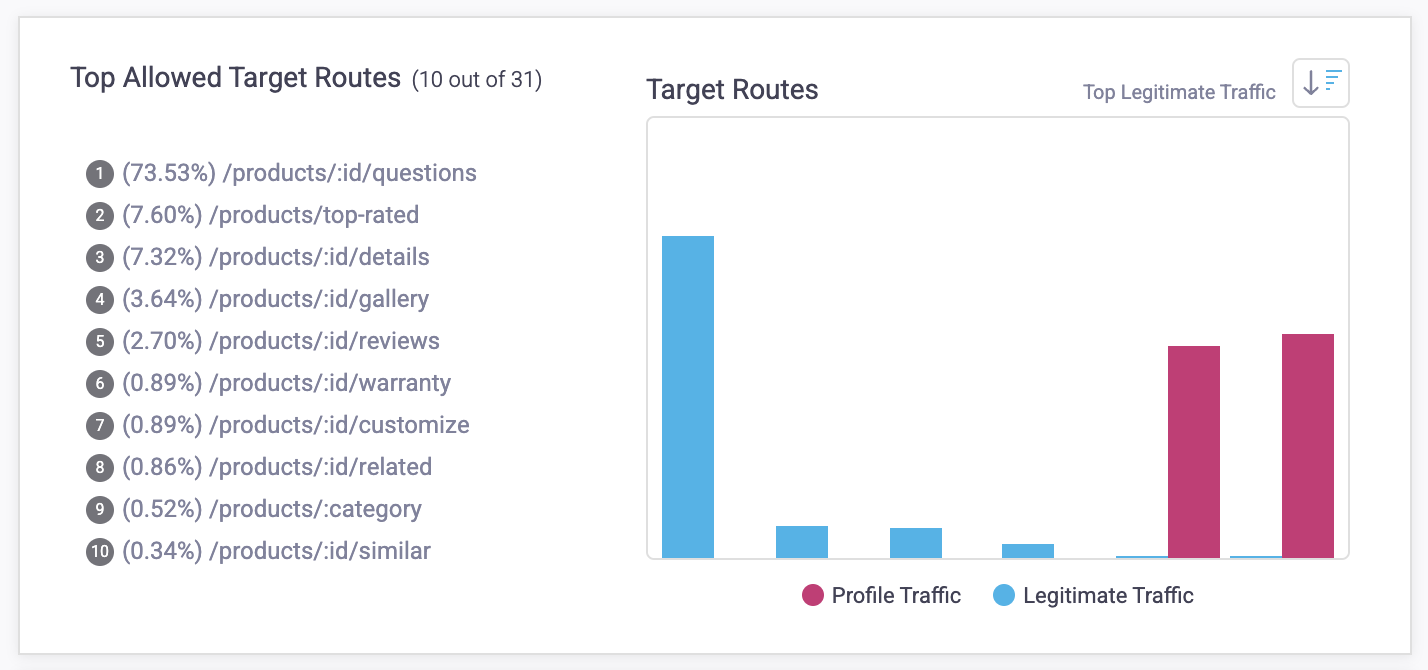
Distribution insights visualize the bot activity associated with each Profile compared to legitimate activity. These are shown in an Attack Profile’s Behaviors view, which you can see by clicking on a Profile. The available insights are:
- Target routes: The routes where traffic is most prevalent. Routes are groups of similar paths that refer to the same page, but may have a unique ID. These IDs are replaced with a variable in HUMAN Sightline. For example, login paths that use unique IDs might be grouped together in a single route like /products/:id.
- ASNs: The most prevalent autonomous system numbers (ASNs) that traffic originated from.
- IPs: The most prevalent IP addresses that traffic originated from. HUMAN Sightline groups similar IP ranges together.
- Devices & Browsers: The most prevalent device and browser pairs that traffic came from.
- Referrers: The most prevalent referrers that traffic came from. Non-referred traffic is indicated by null.
- Regions: The most prevalent regions that traffic originated from. Regions are indicated by country ISO codes.
These insights show the types of behavior HUMAN Sightline looks for when creating Attack Profiles and demonstrates why certain traffic was flagged as bot behavior while others weren’t, particularly if the bots are sophisticated. By observing the distribution of behavior over time across all the insights available, you can follow the model’s reasoning and be confident that the model is really blocking bots.

View Attack Profiles
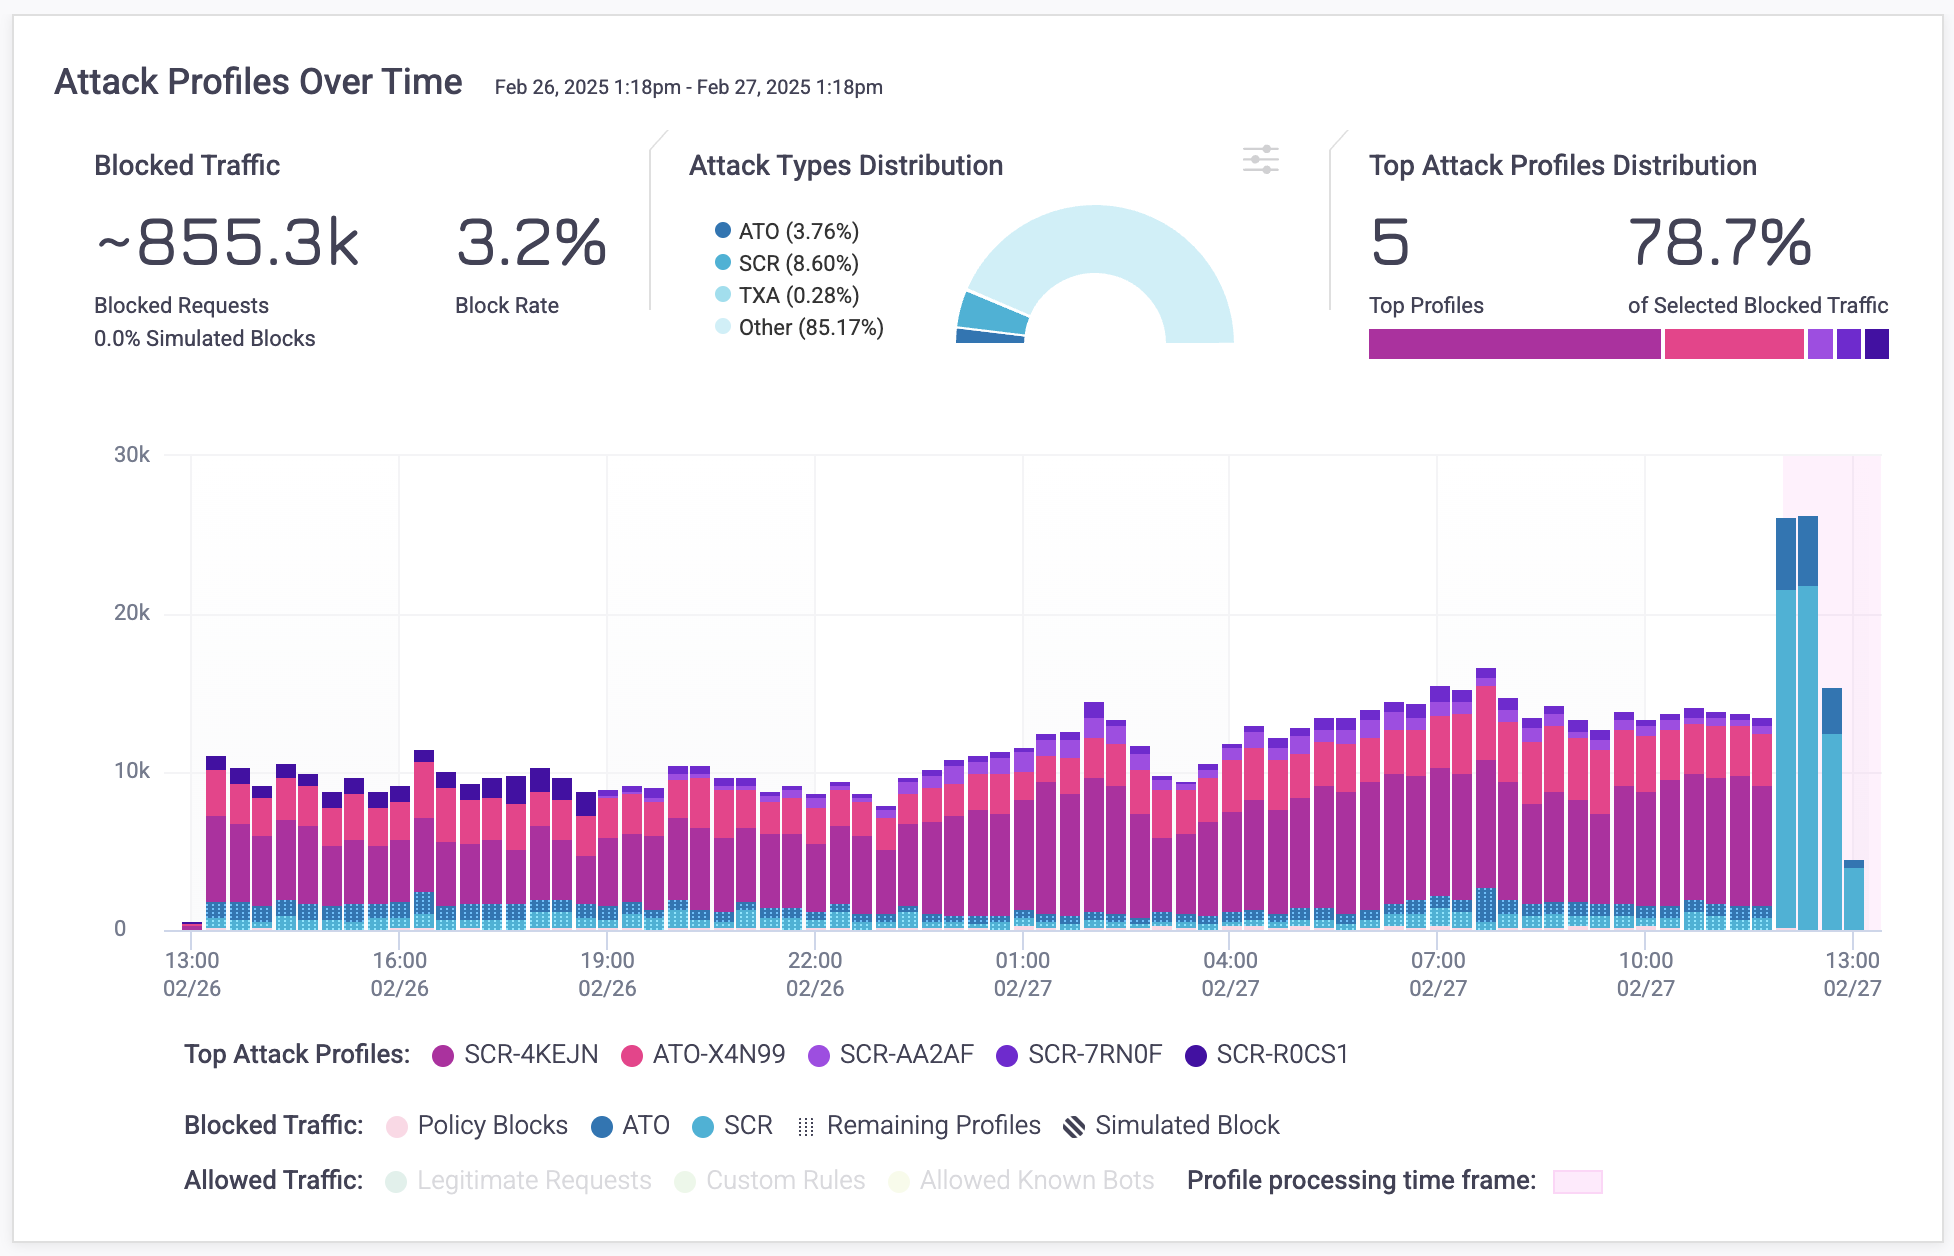
You can view Attack Profiles for your application from Bot Defender > Explore > Dashboards > Sightline Dashboard. The Attack Profiles Over Time graph visualizes the top five most prevalent Attack Profiles, and you can isolate any of these for investigation by clicking on it directly from the graph. This opens its Attack Profile Behaviors.
Any remaining Profiles are grouped together in the graph, and Attack Profiles Overview lists all Profiles individually.
As the HUMAN Sightline model learns over time, it may choose to reassign blocked traffic from one Attack Profile to another. For example, the dashboard may identify very recent traffic as a new Profile, but as time goes on, the model may find that this traffic actually shares characteristics with an existing Profile. If that happens, HUMAN Sightline reassigns the traffic to that Profile instead.
We recommend checking back every few hours to make sure you get the most accurate representation of Attack Profiles, especially for very new traffic collected within the last day.

Processing time
Attack Profiles have a processing time, which means that HUMAN Sightline is still analyzing all the traits in the traffic in that time frame to assign them to a Profile. This time frame is highlighted in the Attack Profiles Over Time graph and typically finishes in two hours.
It’s important to know that traffic within this time frame has already been identified as bots or legitimate and appropriately blocked. For example, in the graph above, the traffic within the time frame was already identified as account takeover and was blocked. This initial block was done in real time. The processing time is the additional secondary detection done by HUMAN Sightline after the initial block. HUMAN Sightline is comparing all of the malicious requests against each other and back in time in order to construct Profiles.