About the Paid Traffic Trends dashboard
The Paid Traffic Trends dashboard tracks your paid traffic and invalid traffic (IVT) activity over time. Paid traffic refers to traffic from paid referrals or traffic generated through paid advertisements and promotional activities. This includes paid advertising campaigns like display ads or search engine marketing. When bots or non-human activities are involved in generating paid traffic, then it’s considered IVT.
Since IVT can inflate ad impressions or skew data, it’s important to track and mitigate it wherever possible. This lets your organization get the most value possible from your paid traffic campaigns and make educated business decisions based on accurate market data. Paid Traffic Trends helps you accomplish this by tracking your paid traffic and exposing any IVT that Sightline detects.
You can find this dashboard from Sightline Cyberfraud Defense > Explore > Traffic > Paid Traffic Trends. This article defines the data you can find in the dashboard. For details about blocked IVT requests and forensics, see About the Paid Traffic Insights dashboard.
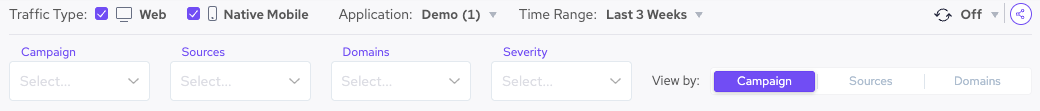
Filters
You can apply filters to refine the data shown. Filters apply to all components in the dashboard. You can filter by default Sightline filters such as Traffic Type or Application as well as by paid traffic data such as Campaigns, Sources, Domains, and Severity.
Additionally, you can toggle the View by data, which changes the context of the data shown. For example, selecting Campaign will show traffic and IVT data per campaign, while selecting Sources will show data per source instead.
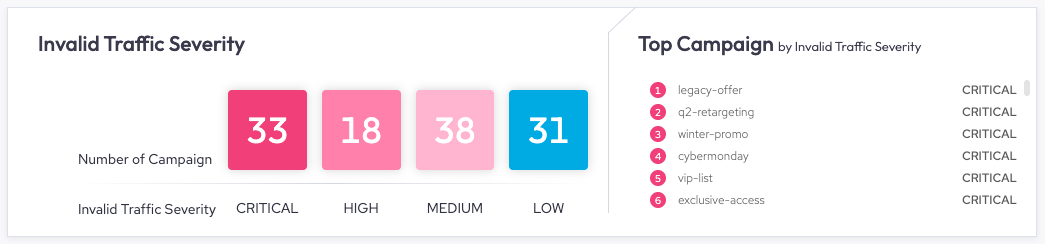
Invalid Traffic Severity & Top severity
The Invalid Traffic Severity chart shows the number of campaigns, sources, or domains with IVT by severity level. This is useful for quickly assessing the amount of IVT Sightline detected in your time range and how severe they were. You can click on any of these numbers to filter the dashboard by that traffic.
The Top severity list displays the campaigns, sources, or domains with the most severe IVT activity. You can use this to find items that need your immediate attention and yield the highest impact. You can hover over and click ![]() to filter the dashboard by that item.
to filter the dashboard by that item.
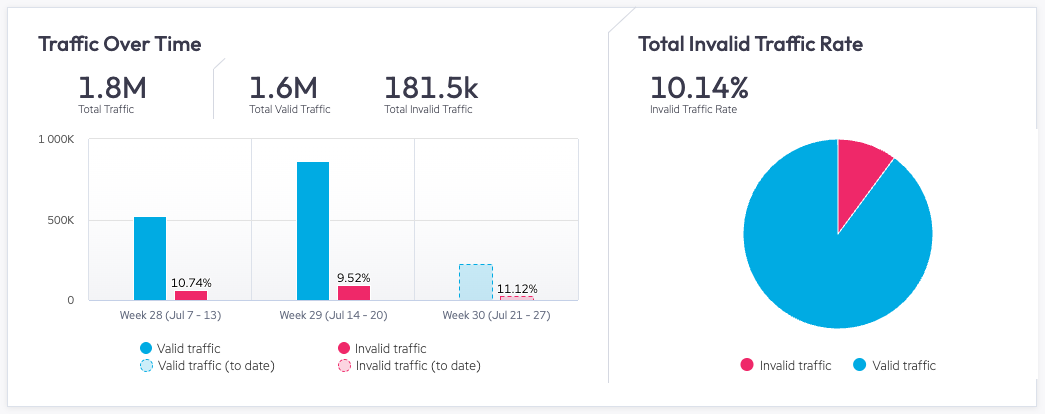
Traffic Over Time & Total Invalid Traffic Rate
The Traffic Over Time graph shows the total traffic and invalid traffic over time for your campaigns, sources, or domains. Sightline displays data in three equal time segments based on your selected time range. For example, if you select a time range of three weeks, then Sightline will show data for each week, as shown below. This is helpful for tracking your overall traffic over each time period and comparing it to the amount of IVT.
The Total Invalid Traffic Rate chart compares the total amount of IVT to total traffic and calculates this proportion as a rate.This lets you quickly assess how much of your traffic is IVT.
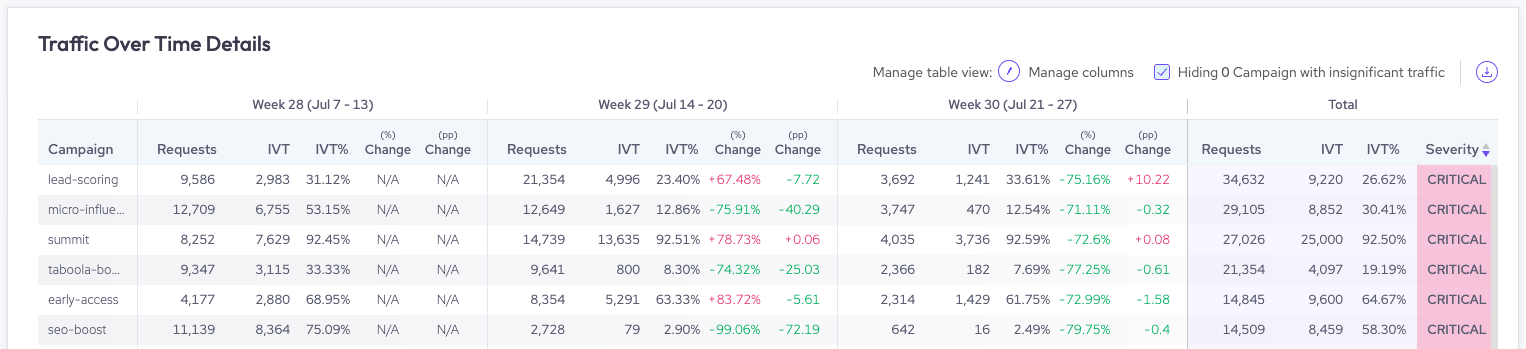
Traffic Over Time Details
Traffic Over Time Details is a table of all requests, traffic, and IVT per campaign, source, or domain. Sightline displays data in three equal time segments based on your selected time range. For example, if you select a time range of three weeks, then Sightline will show data for each week as well as total data, as shown below. This is especially helpful for tracking changes in IVT over time.
The Change (%) and Change (pp) data are based on the current time period’s data compared to the previous one. For example, in the image below, Week 30’s change data is the change compared to Week 29, and Week 29’s is compared to Week 28. Week 28 is the first time period in the time range, so there’s no data to compare it to.
You can customize this view by editing ![]() the columns that appear or choosing whether to hide campaigns with insignificant traffic. You can also download
the columns that appear or choosing whether to hide campaigns with insignificant traffic. You can also download ![]() a CSV of this table.
a CSV of this table.