Sightline Dashboard
The HUMAN Sightline Dashboard lets you track and explore attacks on your application. This dashboard monitors all bot activity on your application and surfaces blocked traffic. You can use this as a secondary detection tool to quickly spot unusual bot behavior and understand Attack Profiles.
The dashboard uses a mixture of statistical analysis and machine-learning models that tracks each Attack Profile with other Attack Profiles, as well as compares Profiles with all past attacks. This means that you can confidently track trends in attacks over time as well as know when emergent attacks occur.
You can access the dashboard via Bot Defender > Explore > Dashboards > Sightline Dashboard. There are a variety of tools you can use to learn about Attack Profiles:
- Filters: Refine the data to find interesting activity or Attack Profiles.
- Attack Profiles Over Time: Track attacks over a selected time period. Useful for seeing unusual activity at a glance.
- Attack Profiles Overview: Review Attack Profiles Bot Defender detected on your application. Bot Defender prioritizes Profiles with the highest threat, so this is useful for finding and investigating the most severe Attack Profiles immediately.
- Attack Profile Behaviors: Accessed by clicking an Attack Profile, this shows detailed information about the Attack Profile, its activity over time, and its behavior on your application. Useful for finding out more details about a Profile that interests you.
For more on identifying, interpreting, and understanding HUMAN Sightline data, see our article on Understanding Sightline Dashboard activity.
Note
If you are a new customer or have just started to use the Sightline Dashboard, it can take four to seven days for data to be meaningful. HUMAN Sightline retains data for up to 14 months.
Filters
You can apply filters to the Sightline Dashboard to find interesting bot activity. Filters apply to the entire dashboard. This means the data from Attack Profiles Over Time, Attack Profiles Overview, and Attack Profile Behaviors all reflect the filters you apply from here.

There are a variety of filters available:
- Traffic Type: Filter by where the traffic came from, such as from web or native mobile applications.
- Application: Filter by the applications you’ve created in HUMAN.
- Threat Type: Filter by the type of bot activity. This can be especially useful if you have a large distribution of a certain threat type and want to look at activity that’s less prevalent.
- Time Period: Filter by a specified time period.
- Source: Filter by the traffic’s source, such as organic traffic or paid traffic.
Attack Profiles Over Time
The Attack Profiles Over Time area shows statistics and a graph of your application traffic over the selected time period. You can get a quick summary of traffic and observe unusual behavior from this area.
Warning
If you see an error here, this indicates that at least one part of any of your applications has an Enforcer that does not support attack profiling. Even if most of your dashboard data seems correct, this error means there is something that needs your attention. This typically occurs when:
- The Enforcer is outdated and needs to be upgraded to its latest version, or
- The Enforcer is not detecting any traffic and needs to be reconfigured to do so.
The latter situation is more rare, and we recommend trying to update the Enforcer first. If that doesn’t resolve the error, reach out to [email protected].
Statistics
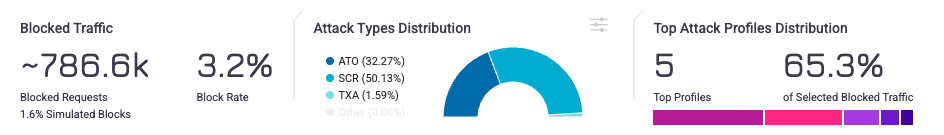
Interesting statistics are shown at the top of this area and provide a summary of your traffic.
- Blocked Traffic: Shows how much traffic Bot Defender blocked, and what percentage of total traffic was blocked.
- Attack Types Distribution: The types of attacks over the time period. You can see how incidents are defined in our article.
- Top Attack Profiles Distribution: Shows the top five Attack Profiles over the time period and the percentage of blocked activity that was from these top Profiles.
Graph
The graph shows traffic on your selected applications over time. Each traffic type can be clicked to add or remove it from the graph.
- Top Attack Profiles: These are the top five most prevalent Attack Profiles over the selected time period. Each of these Profiles are uniquely named and color-coded so you can quickly identify them on the graph. This top five may change if you pick a different time frame. Remaining Profiles, which are Profiles other than the top five, are marked with
 . You can view these Profiles individually in the Attack Profiles Overview.
 - Blocked Traffic: Any remaining traffic that HUMAN did not associate with the top Attack Profiles are grouped together and color-coded as shown in blocked traffic.
- Allowed Traffic: Any traffic that wasn’t blocked. These are filtered out by default, but you can click any of the allowed traffic types to add them into the graph.
- Profile processing time frame: This colored block indicates the time frame where HUMAN Sightline is still profiling. Traffic shown here is still all traffic that was successfully blocked and identified with an attack type, but HUMAN is still analyzing the traffic to assign characteristics and ultimately generate Attack Profiles from it. Data typically takes about two hours to process.
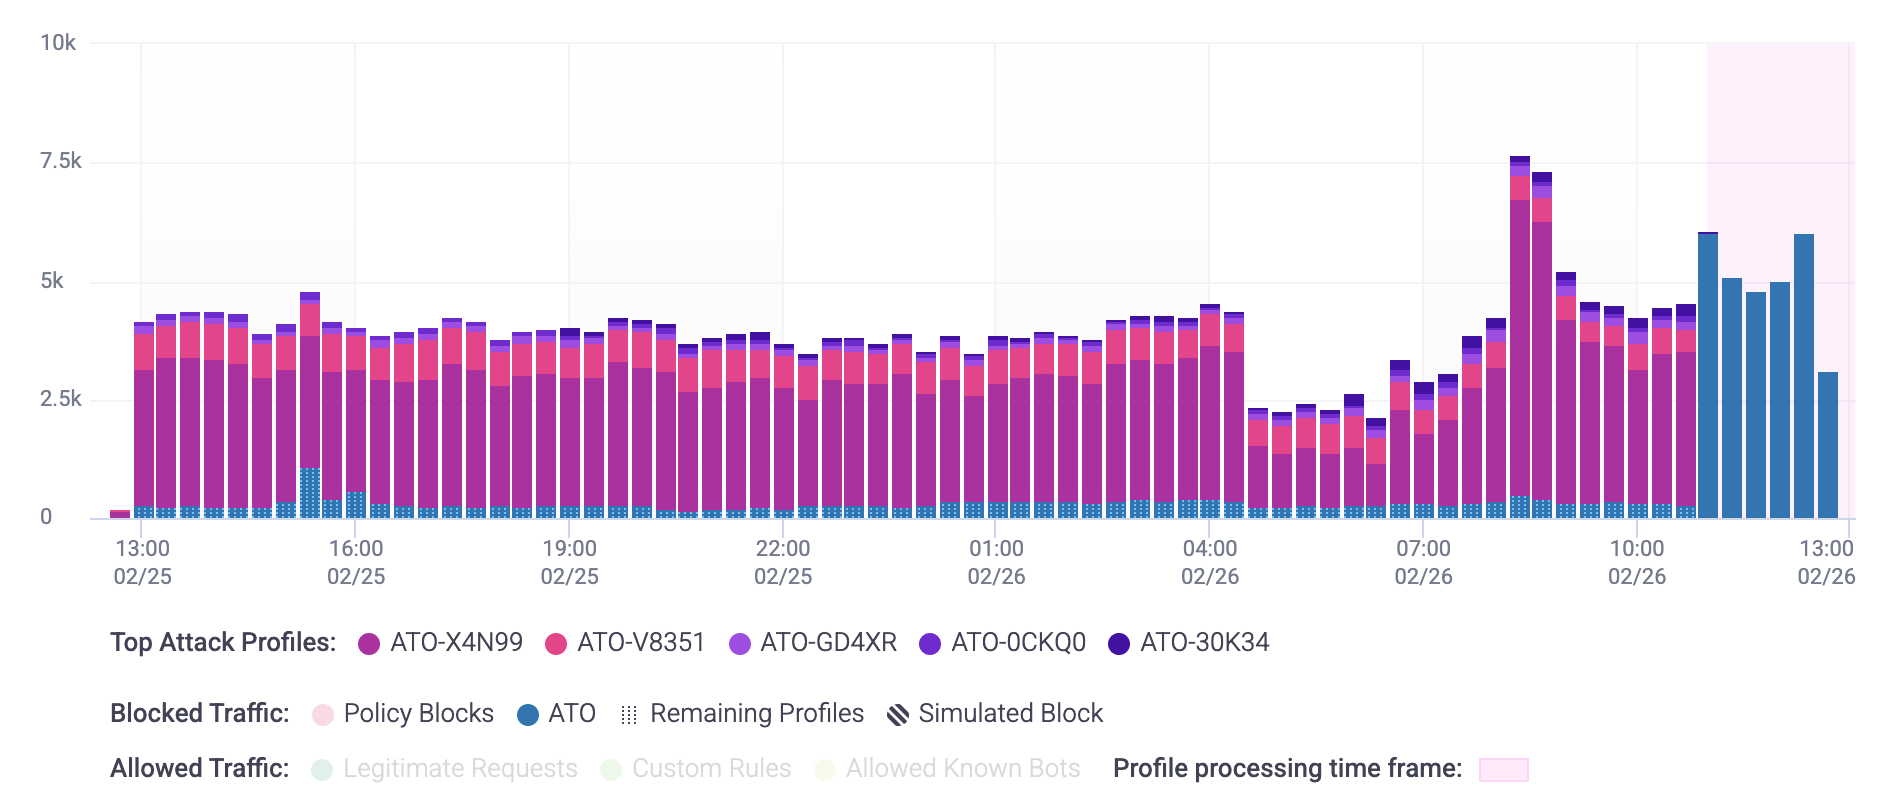
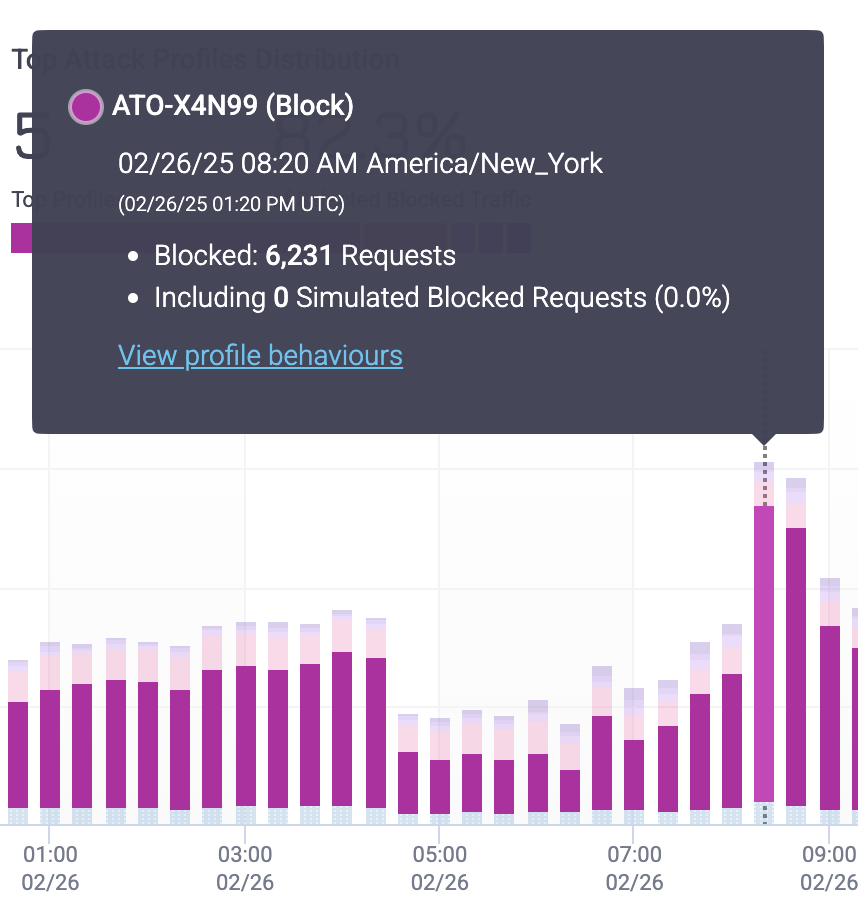
Once you find an Attack Profile that seems unusual, you can hover over and click the Profile directly from the graph to open its Attack Profile Behaviors.
Attack Profiles Overview
The Attack Profiles Overview is a list of all detected Attack Profiles over the selected time period. Each Attack Profile comes with details that you can use to learn about attacks made on your application.
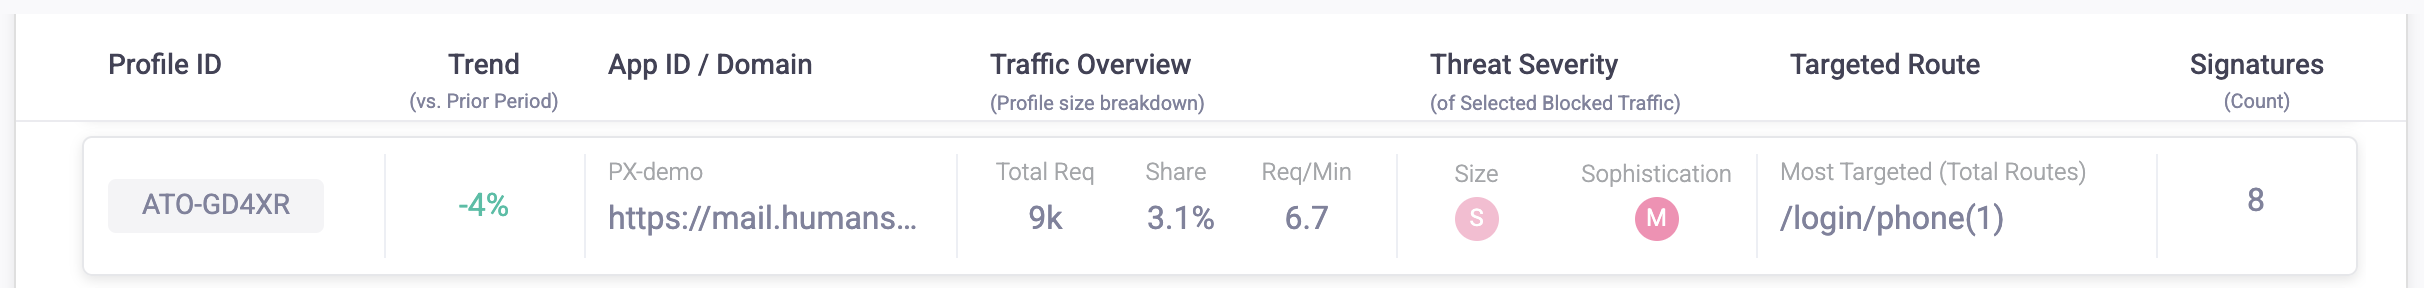
- Profile ID: The ID Bot Defender assigned to the Attack Profile. HUMAN Sightline names Profiles according to the threat type and a series of letters and numbers. For example, SCR-XA3N3 is a scraping Profile. The available threat types are listed below.
Each ID is unique. Profiles are never assigned the same ID, including on other customers’ applications. This means that, even if two Profiles on two different customer applications are the same attacker, they will still have two different IDs.- ATO: Account Takeover
- SCR: Scraping
- TXA: Transaction abuse
- Trend: Any differences in the Profile’s activity compared to a previous time period. Negative values indicate that there’s been less activity from this Profile compared to previously, while positive ones indicate that the Profile’s activity has increased. The trend compares the data from the current time period to data from the same amount of time before that period. For example, when looking at three hours of traffic, the Trend will compare to the previous three hours. Similarly, when looking at 30 days of traffic, the Trend will compare to the previous 30 days. If the previous period didn’t have Profile that has since appeared in the current period, the Trend may have a large number instead, such as 5000%.
- App ID / Domain: The domain that the Profile was most active on. However, the Profile may be active on multiple domains.
- Traffic Overview: A breakdown of the size of the Profile, or how much traffic this Profile constituted over the time period.
- Threat Severity: The level of threat of the Profile. Highest severity Profiles appear at the top of the list.
- Targeted Route: The most targeted endpoint the Profile attacked on the domain.
- Signatures: The number of signatures the Profile has. You can learn more about signatures from Attack Profile Behaviors.
Once you find an Attack Profile that seems unusual or you want to learn more about, you can click on one directly. This opens its Attack Profile Behaviors.
Attack Profile Behaviors
An Attack Profile Behaviors view has unique, in-depth information for each Attack Profile. You can access it by clicking on any Attack Profile that interests you.
Tip
You can use
to expand this view.
This view shows detailed statistics and information that the Attack Profiles Overview already summarizes. You can also see a detailed timeline of its activity over the selected time period.
In addition to the information covered in Attack Profiles overview, there are some expanded insights that you can learn about below.
General information
You can get a quick summary when you first open an Attack Profile.
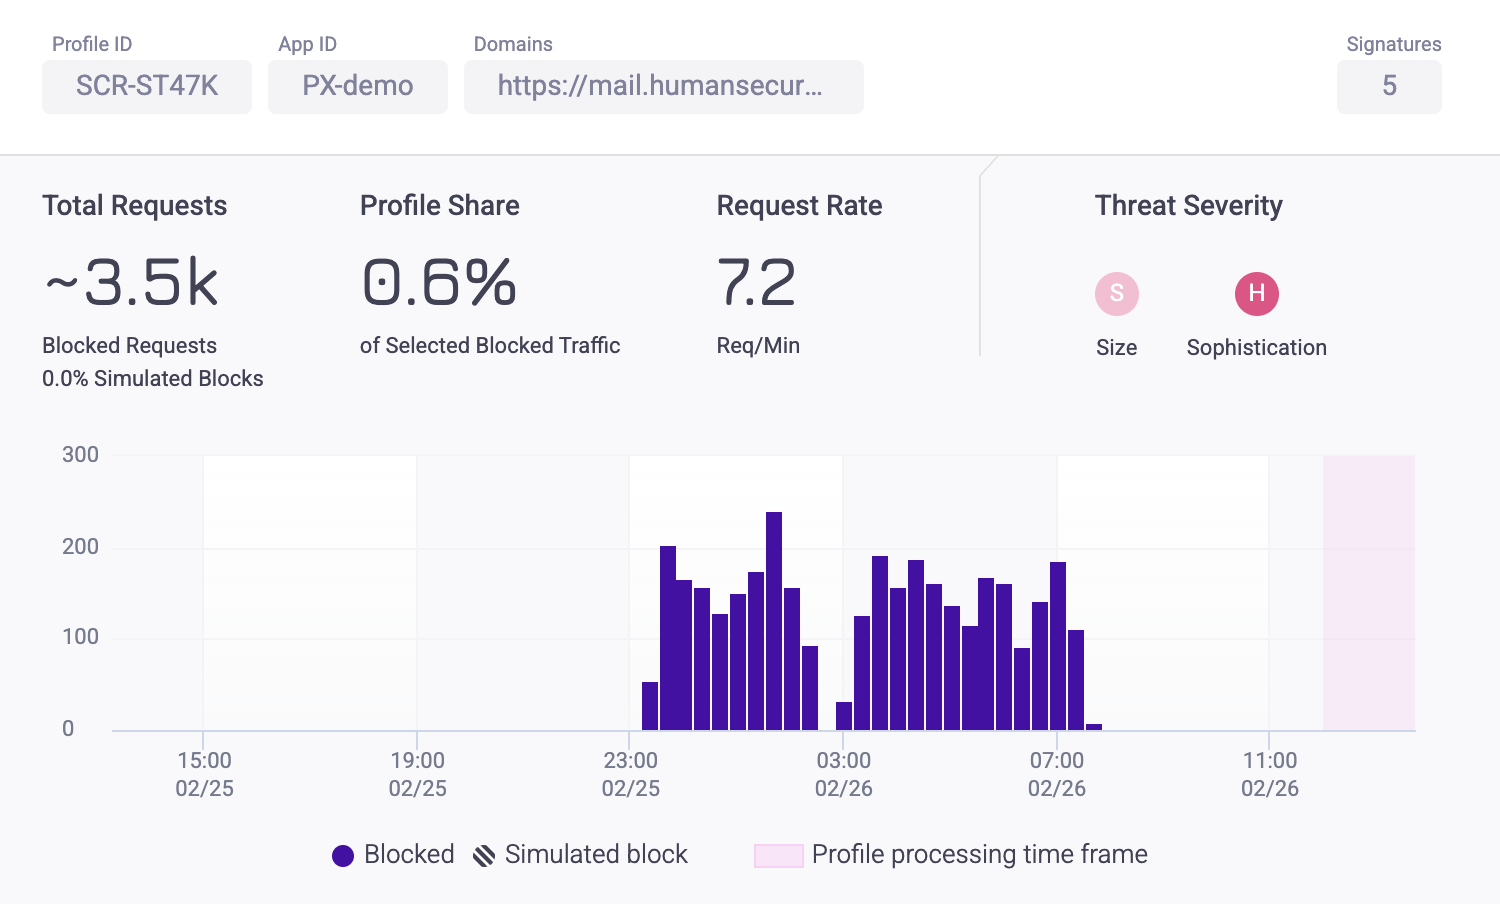
Each Attack Profile has the same information and statistics shown:
- Profile ID: The ID Bot Defender assigned to the Attack Profile. HUMAN Sightline names Profiles according to the threat type and a series of letters and numbers. For example, SCR-XA3N3 is a scraping Profile. The available threat types are listed below.
Each ID is unique. Profiles are never assigned the same ID, including on other customers’ applications. This means that, even if two Profiles on two different customer applications are the same attacker, they will still have two different IDs.- ATO: Account Takeover
- SCR: Scraping
- TXA: Transaction abuse
- App ID: The ID for the application where BD detected the Attack Profile.
- Domains: The domain that the Profile was most active on. However, the Profile may be active on multiple domains.
- Signatures: The number of signatures the Profile has. Signatures are the number of characteristics HUMAN Sightline has flagged on this Attack Profile that indicate bot behavior. These characteristics are determined with common, generic indicators applicable to all bots as well as specific behaviors HUMAN Sightline has catalogued while monitoring each individual Attack Profile. As time goes on and the more we learn about the bots, an Attack Profile gains more signatures. This indicates that, while bots can change their behaviors, HUMAN Sightline continues to adapt and track the bots from the original Attack Profile.
- Total Requests: The number of requests made over the selected time period.
- Profile Share: The prevalence of blocked traffic from this Attack Profile out of all blocked traffic on your application.
- Request Rate: The number of requests the Profile made per minute. If the Attack Profile was active over a period of time that was less than the selected time period, then the requests per minute will be averaged only over the time the Profile was active. For example, if you have selected data for the last day, but the Profile was only active for eight hours, then the request rate will reflect the rate over eight hours rather than the full day.
- Threat Severity: The level of threat of the Profile. Highest severity Profiles appear at the top of the list.
Profile Characteristics
Profile Characteristics show the distribution of the Profile’s attributes that indicated bot behavior. There are multiple characteristics you can view.
Tip
You can use
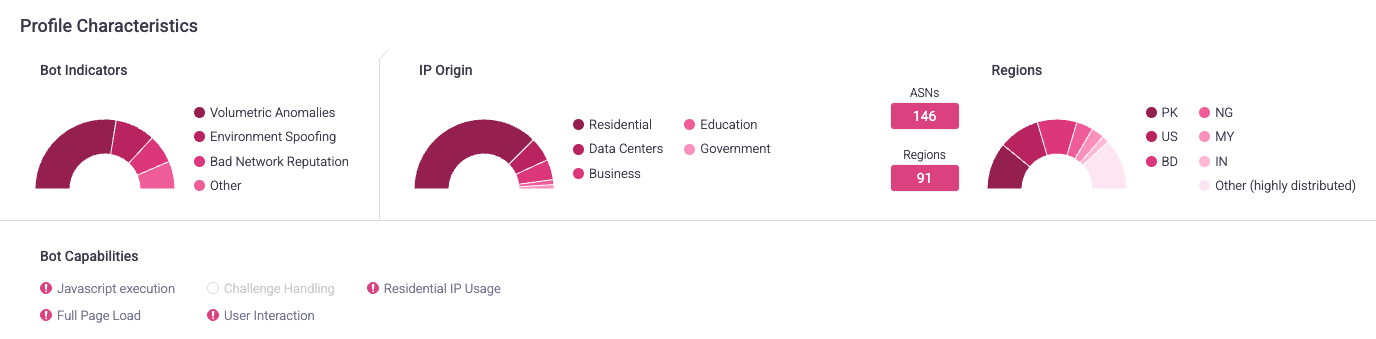
Bot Indicators
This area shows the distribution of bot behaviors that the Profile’s requests exhibited. In other words, this shows why requests were flagged as bots. Bot Indicators shows the top two most prevalent indicators for a Profile, and any remaining indicators are grouped in Other.
You can view a full list of available indicators in our article.
Bot Capabilities
This area shows the distribution of capabilities that the Profile’s requests exhibited. Bot Capabilities refer to how sophisticated the bots were. In other words, this area shows how these requests tried to act like humans. Bot Capabilities shows the top two most prevalent indicators for a Profile, and any remaining indicators are grouped in Other.
You can view a full list of available indicators in our article.
IP Origin
This area shows the distribution of IP addresses’ sources or environments that the Profile’s requests came from. Knowing where the bots came from can indicate how sophisticated they are or if this Profile’s requests are from a centralized area. IP Origin shows the top two most prevalent origins for a Profile, and any remaining origins are grouped in Other.
You can view a full list of available indicators in our article.
Regions
This area shows the top two most prevalent regions the Profile’s requests came from, with any remaining regions grouped in Other. Regions are indicated by country ISO codes.
It also shows how many autonomous system numbers (ASNs) and regions the bots came from. Higher numbers typically indicate that the bots that made the requests are more sophisticated and trying to act more like humans. However, this doesn’t necessarily mean Profiles with low numbers aren’t sophisticated. For example, bots that use residential IPs, or Residential IP Usage, tend to be more sophisticated. In that case, you’d also expect that the number of regions is low, because that type of traffic typically is concentrated from the U.S.
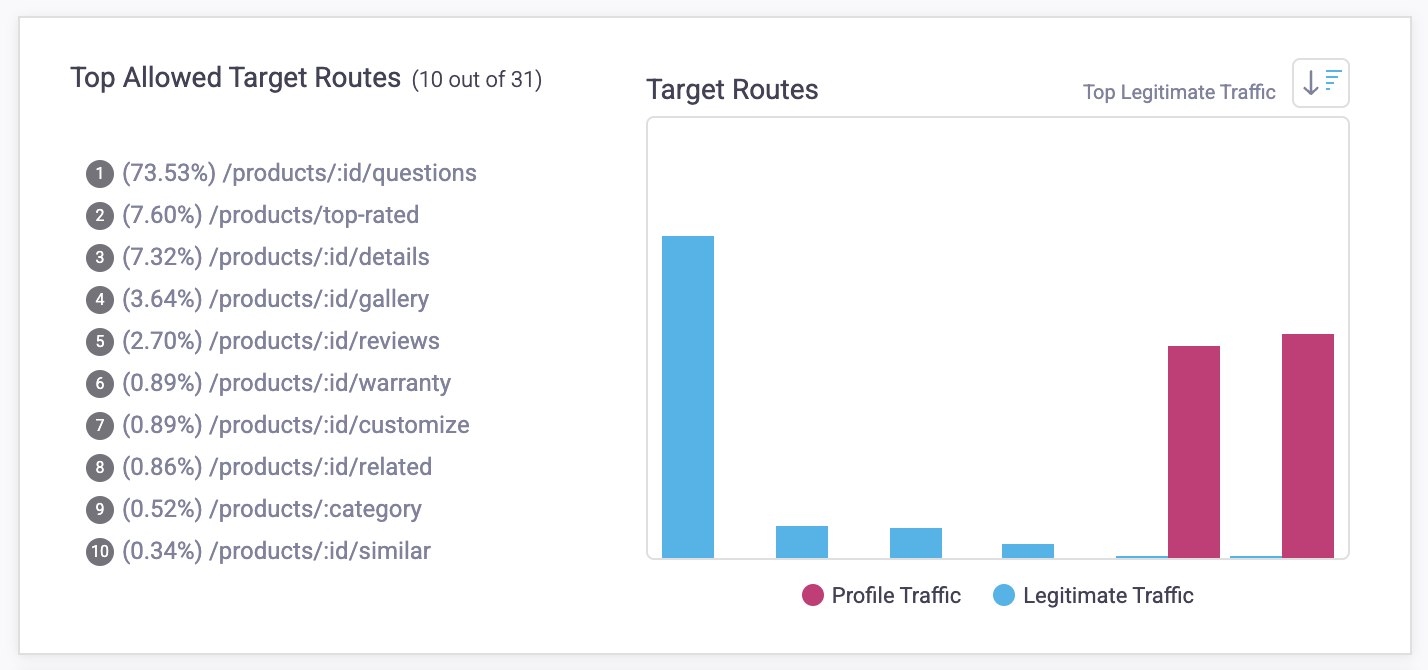
Profile Distribution Insights
Profile Distribution Insights lets you understand the Attack Profile’s behavior compared to legitimate behavior on the same identifier. Identifiers can be filtered by top legitimate traffic ![]() or by top Profile traffic
or by top Profile traffic ![]() . This lets you immediately compare Attack Profile activity from human traffic so you can understand why certain activity was blocked.
. This lets you immediately compare Attack Profile activity from human traffic so you can understand why certain activity was blocked.
There are different types of identifiers.
- Target routes: The routes where traffic is most prevalent. Routes are groups of similar paths that refer to the same page, but may have a unique ID. These IDs are replaced with a variable in HUMAN Sightline. For example, login paths that use unique IDs might be grouped together in a single route like /products/:id.
- ASNs: The most prevalent autonomous system numbers (ASNs) that traffic originated from.
- IPs: The most prevalent IP addresses that traffic originated from. HUMAN Sightline groups similar IP ranges together.
- Devices & Browsers: The most prevalent device and browser pairs that traffic came from.
- Referrers: The most prevalent referrers that traffic came from. Non-referred traffic is indicated by null.
- Regions: The most prevalent regions that traffic originated from. Regions are indicated by country ISO codes.
Updated 6 months ago