Navigate the Dashboard
An in-depth analysis of the applications’ data and traffic
The Bot Defender Portal Dashboard presents an in-depth analysis of the applications’ data and traffic.
Traffic Over Time
At the top of the Traffic Over Time chart you can find the figures that can be summed together to get the Total Requests number: Legitimate Requests, Blocked Requests, Allowed Known Bots & Crawlers and Custom Allowlist (see below to learn what each of these metrics represents).
The trends presented in the Traffic Over Time chart present the trend of each of the main six metrics during the timeframe selected at the top of the Dashboard: Legitimate Requests, Blocked Requests, Simulated Block, & Crawlers, Custom Allowlist, Custom Denylist, Allowed Known Bots & Crawlers and Captcha Solved).
Hover over the graph to see total numbers for each of the metrics at a specific point in time.
Hover or click on each of the metrics below the graph to highlight each the metrics trend.
Available Metrics
Filtering Dashboard Data
Filtering the Dashboard data allows the user to define and personalize the data presented in each Dashboard Component. The data can be filtered by Traffic, Browser type, OS, Country of origin, and Page Types. By default, there are no filters applied to the data presented in the Dashboard.
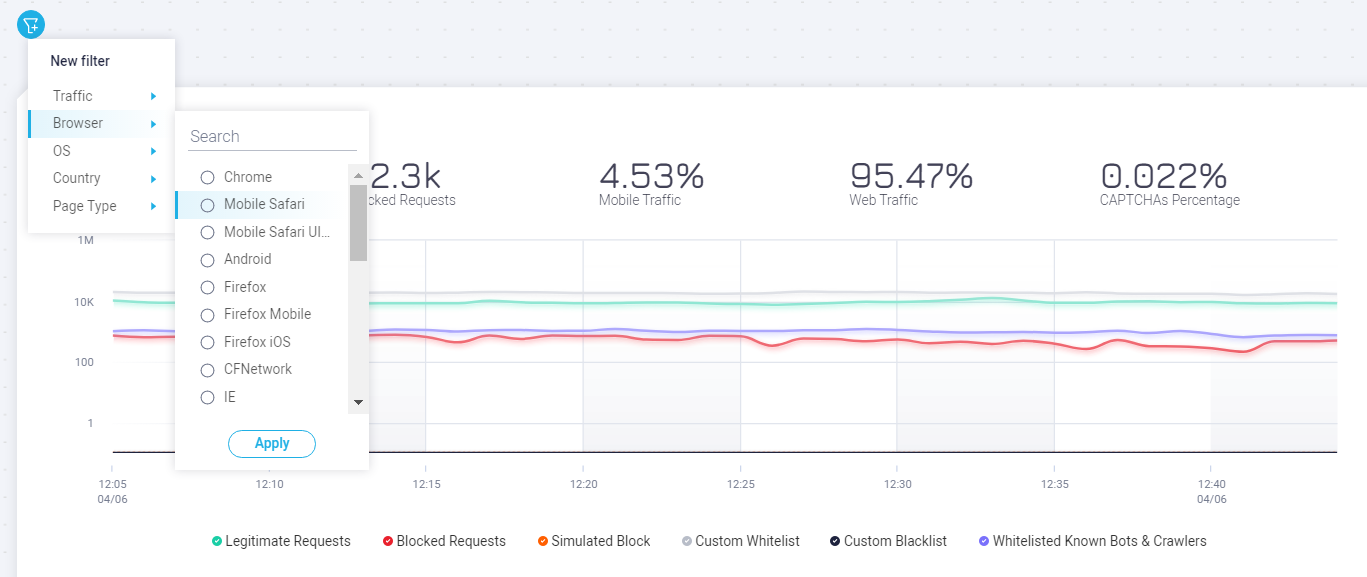
- To set a new filter, click the Filter button. Select the filter parameters and click Apply.
Filter parameters are sorted according to the filter category (for example, all OS filter parameters are listed within the OS filter.) - To search for a specific filter parameter, enter the search query in the filter’s search bar.
- To remove a filter, click the X next to the filter. This removes the entire filter and all parameters within that filter.
Set filters are applied to all data and all components in the Dashboard, and to Search results. The filters are not applied to other Bot Defender Dashboard tabs.
Dive In - Select a Specific Time Range
You can dive into sections of interest by selecting a specific time range from any line chart in the Dashboard.
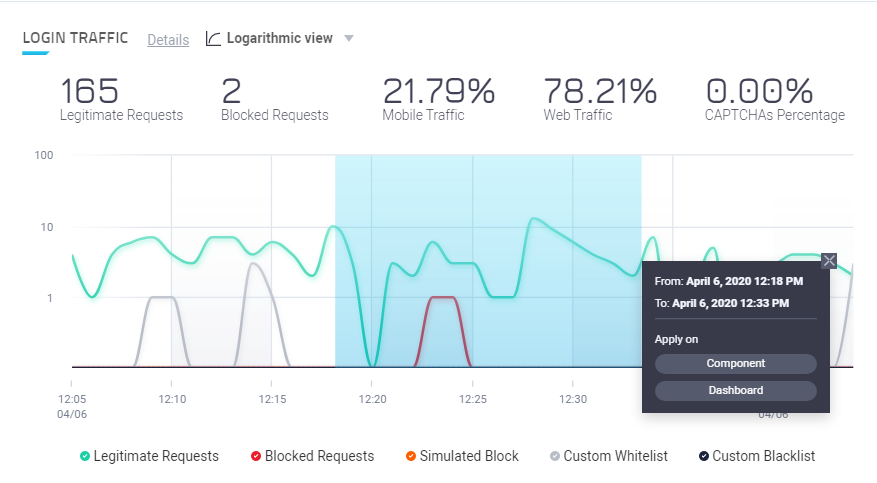
- Click and drag over the required time range of any chart in the Dashboard.
The selected time range can be applied to the specific component or to the whole Dashboard.
Click the revert arrow to go back to the default time range.
Web and Mobile Traffic
Traffic is considered as Mobile traffic in the dashboard based on either the HUMAN SDK header and/or the customer’s native mobile application user agent. If traffic does not fall into these two categories, Mobile traffic will be 0.0%, even when the Mobile radio button is selected.
The Web and Mobile radio buttons allow you to view traffic from your Web application and/or from your native Mobile application.
Traffic from a mobile device to a Web application is considered Web traffic.
Data Availability
In certain cases, HUMAN may need more visibility into your site traffic, to be able to properly report and display data.
No data for a Page Type
If no data is available for a Page Type, we recommend that you update your page type mappings. You can also forward us more traffic for that specific page type.
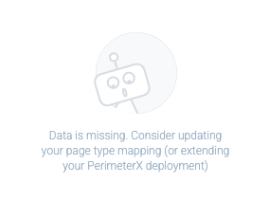
No Data
In the case of an error retrieving data for a widget, you can refresh the specific widget without affecting the data presented in other widgets.

Depending on your filter settings, there may be no data for certain widgets. To display data for these widgets you need to change your Dashboard filter settings such as timeframe, selected applications, and such.

Time Range Error
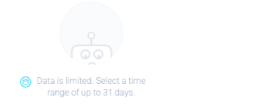
All “Tops” widgets display data of up to 30 days. If your time range is more than 30 days, you will be prompted to open the Date Picker and select a time range within the 30 days.
Changing the time range will affect data on all widgets in the Dashboard.
Search
Dashboard Search allows users to search for specific data/content, and focus on that data in detail. The search results are displayed in the Investigation page. The multiple query parameters and operators allow users to refine the search parameters and return the desired results.
Performing a Search
Search automatically includes wildcards before and after the search parameters and does not require escape characters. To search, simply enter the search parameters. The results will include both prefixed and suffixed results.
For example: Searching for /api/ returns abc/api/ and /api/abc/ etc. You can also search for null to find results for values that do not exist.
To search for a range of IPs you must use CIDR notation (IP is not a string, and so searching with * will not work). CIDR notation is the IP address with a slash character / and a decimal number at the end of the IP address.
More information on how to search using CIDR notation is available here.
To Search:
- Click the Search Icon to open the Search Bar and display the available search entities.
- Select an entity, and enter the query parameters (not case sensitive).
- To refine the search, use operators between search parameters. The following operators are available:
-
AND - Includes data for both/all query entities
-
OR - Includes data for either one query entity or the other query entity
-
NOT - Excludes data from the search. NOT must be used to exclude specific data from search parameters entered. NOT cannot be used as the only search operator.
-
( ) - Allows multiple entities to be added as qualifiers. An operator (AND, OR, NOT) must be included within the
( ). For example Path: /abc/ AND (Path: /def/ OR Path: /ghi/)Operator Precedence
When performing a search with multiple operators, the AND operator takes precedence over the OR operator. We recommend using ”( )” when searching with multiple operators.
For example, when searching for data on two IPs accessing a specific path: Searching
Path:/a/path AND (IP:1.1.1.1 OR IP:2.2.2.2)returns data on the two IPs accessing the specific path. Whereas searchingPath:/a/path AND IP:1.1.1.1 OR IP:2.2.2.2returns similar results to(Path:/a/path AND IP:1.1.1.1) OR IP:2.2.2.2which is not what the query is meant to return.- Click Go
-

The search results are presented in Bot Defender Portal’s Investigation Page.
Search is always applied as a “like” method, unless a specific regex is applied. For example, when searching “login” in a path, all login contained pages (i.e. example/login.com, example/login_product.com) are returned
Clear Block ID
In some cases, a human user may be blocked on a Challenge page. The Clear Block ID function lets you to unblock them for a specified period of time. Clear Block ID is available in the Dashboard and Investigation search function To clear the user you must have their Reference ID (found at the bottom of the user’s Challenge page)
- Select Block ID from the Search options, enter the Block ID Reference ID in the Search Bar and click Clear Block ID

- In the pop-up select the Block ID that you wish to clear, and the time period you want it cleared

- Confirm that you that you want to clear the selected Block ID for the selected time period. The Block ID is cleared after you click Confirm
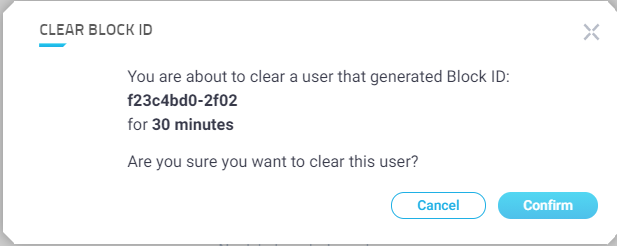
Click Cancel to return to the selection pane.
Please note that a Block ID can only be released within 24h of the initial block.