Investigate the Data
Deep-dive into specific traffic in the Dashboard
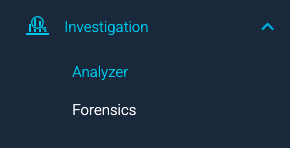
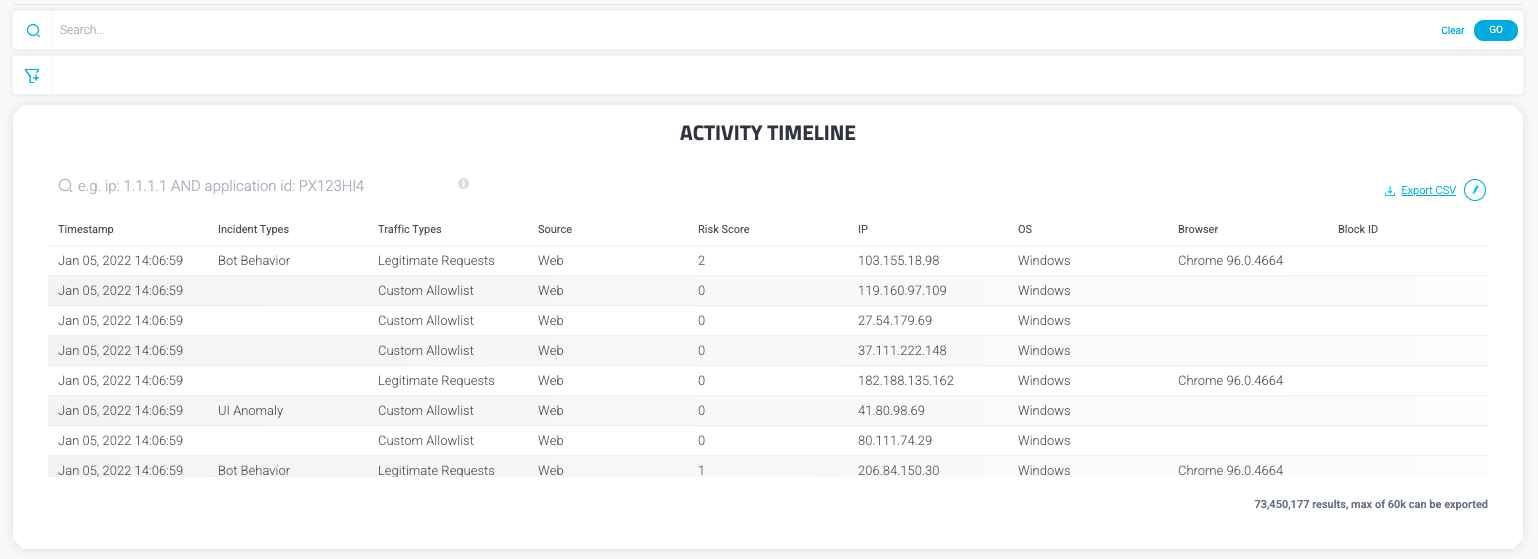
The Investigation page is made up of two correlating tabs; Analyzer and Forensics. The Analyzer tab presents detailed search results and insights into traffic sources. The Forensics tab presents the Activity Timeline, a raw data table relevant to the search parameters.
The Investigation toggle allows you to navigate between the the Analyzer and Forensics tabs.

Incident Types
Investigation Time Range
When the Investigation page is opened independent of a Search, all of the account data is presented for the Time Range selected.
If the Time Range applied to the search is more than 14 days, the last 14 days of data is presented.
Filters
The filters in the Investigation page allow users to fine-tune the data presented. The filters in the Investigation page are the same filters as in the Dashboard_, but apart from the Time Range and the Applications selected do not carry over from the Dashboard during a search. The filters affect all data in the Investigation page.
Investigation Analyzer

The data generated by the search is presented in the Analyzer tab. A breakdown of all traffic sources contributing to the total percentage are listed.
Included in the Analyzer tab are the following components:
- Traffic Over Time
- Incident Types
- Top Countries
- Cloud Vendors
- Services IP Classification
- Top Paths
- Top 10 IPs
- Top User Agents
- Header Referrers
- To 10 ASN Organizations
Also included in the Investigation tab is the Activity Timeline. This table presents the raw data used to create the components in the tab.
Investigation Forensics (Activity Timeline)

The raw data table is displayed in the Forensics tab. It allows users to investigate raw data relevant to the information presented in the Analyzer components. The data is subject to the applied filters and provides up to the most 60,000 recent requests.
Users can choose which data is presented in the table by adding or removing various columns. The table’s configuration is saved per user.
Search
The data in the Forensics table can be filtered per column(s) of interest.
![]()
Some tips for searching the Forensics table:
- Enter the column name followed by
:eg. Traffic Types: - There must be a space between the
:and the value - Column names are not case sensitive
- All operators can be used
Search example: Traffic type: Legitimate Requests AND (ip: 27.62.247.167 OR IP: 1.64.71.81)
Table data can be exported to a CSV file with a maximum of 60K rows.