About the Overview dashboard
Sightline Cyberfraud Defense’s Overview dashboard summarizes insights, user behaviors, user experiences, and business impact your mitigation efforts have on your applications and traffic. This dashboard is a great place to assess the overall state of your applications, learn how Sightline is securing your sites, and determine critical items to address first.
If some widgets do not have data, this typically indicates that at least one part of your application has an unsupported Enforcer. Even if most of your dashboard data seems correct, this error means there’s something that needs your attention. In addition, some legacy installs will need internal configuration changes to support the new data. This typically occurs when:
- The Enforcer is outdated and needs to be upgraded to its latest version
- The Enforcer is not detecting any traffic and needs to be reconfigured to do so
The latter situation is more rare, so we recommend trying to update the Enforcer first. If that doesn’t resolve the error, reach out to contact-support@humansecurity.com.
You can find this dashboard from Sightline Cyberfraud Defense > Overview > Overview. You can learn more about the information available here with this article.
Filters
You can update the filters at the top of the page to change the data that’s displayed in the Overview. These filters apply to the entire dashboard.
![]()
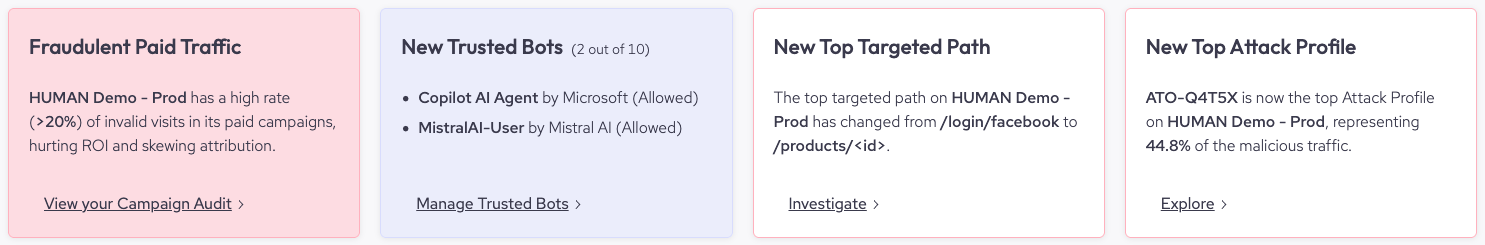
Insights
The Insights highlight interesting updates or critical items that need your review. These include changes to the most commonly targeted path, new trusted bots, your current IVT rate, and others. You can refer to these insights if you’re not sure what to address next in your Sightline configuration.
Sessions & Business reporting
The Sessions/Business section shows the impact Sightline has had on your applications and users. This is a great place to assess how well Sightline protects your business.
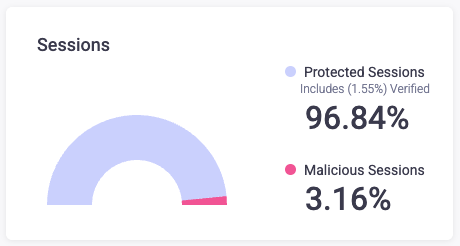
Sessions
The Sessions distribution and statistics show how many sessions Sightline has protected or blocked within your selected time range. This is useful for understanding how many legitimate sessions Sightline has protected and how many malicious ones it’s blocked. Malicious sessions can be especially interesting because sophisticated bots typically attempt to act like legitimate users and have sessions.
Sightline breaks down your all of your sessions into three statistics:
- Protected Sessions: The total number of sessions that did not encounter direct mitigations at any point. This includes sessions that may have had a simulated block.
- Verified Sessions: The total number of sessions that experienced at least one soft mitigation, but did not get blocked. Since verified sessions are not directly mitigated, these are a subset of protected sessions.
- Malicious Sessions: The total number of sessions that encountered direct mitigation, including those that encountered soft mitigation and failed to pass it.
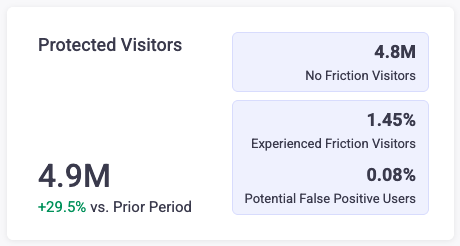
Protected Visitors
Protected Visitors shows the number of visitors Sightline has protected and verified over your selected time range. This helps you evaluate how Sightline impacted your visitors. There are four statistics displayed here:
- Total Protected Visitors: The total number of visitors who did not encounter direct mitigations during their last session. This also shows the change in protected visitors compared to the last period, which is determined by your selected time range. For example, if you have the last 7 days selected, then Sightline will compare visitors to the 7 days before that.
- No Friction Users: The number of users who did not experience any direct mitigation or soft mitigation.
- Experienced Friction Visitors: The percentage of users who experienced some sort of soft mitigation but were not blocked during their last session.
- Potential False Positive Users: The percentage of users who experienced some sort of soft mitigation and were ultimately blocked during their last session.
Protection Impact
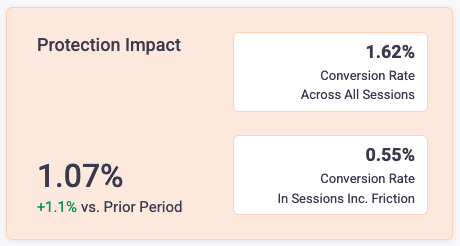
Protection Impact shows how Sightline impacted your users’ conversions across sessions in your time range. This is useful for assessing whether Sightline is impacting your business or not, particularly for users that are encountering friction on your application. Sightline displays three statistics here:
These statistics only include non-malicious sessions. Sightline counts a conversion when a session reaches a checkout complete page.
- Protection Impact: The difference between the Conversion Rate Across All Sessions and the Conversion Rate in Sessions including Friction. This also shows the change in protection impact compared to the last period, which is determined by your selected time range. For example, if you have the last 7 days selected, then Sightline will compare to the 7 days before that.
- Conversion Rate Across All Sessions: The total number of sessions that reached the checkout complete page ÷ the total number of sessions.
- Conversion Rate in Sessions including Friction: The total number of sessions that encountered soft mitigation and reached the checkout complete page ÷ the total number of sessions.
Threat and Mitigation
The Threat and Mitigation section shows the number of mitigation actions taken, the number of potential threats added to Sightline’s database, and a summary of malicious traffic within the time range. This section is best for quickly assessing recent malicious activity and their characteristics from one place.
Direct & Soft Mitigation
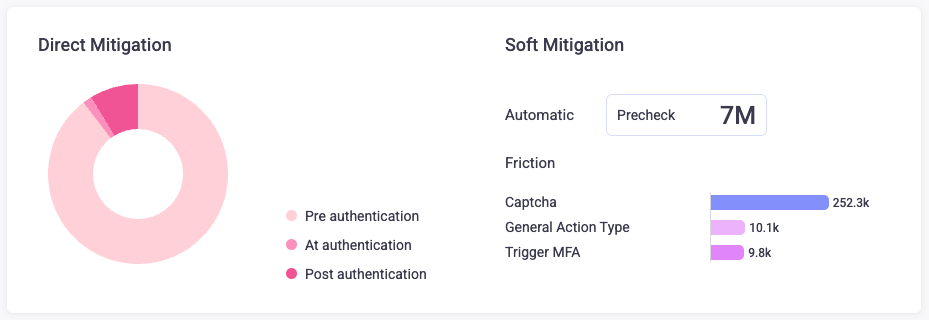
Direct and Soft Mitigation shows the number of mitigation actions Sightline took on traffic during the selected time range. Direct mitigation shows a distribution of direct mitigations Sightline presented at different points in the user journey. This is useful for determining where malicious bot behavior is targeting your application. There are three statistics shown here:
- Pre-authentication: The total number of blocked requests that Sightline presented to visitors that were not logged in.
- At authentication: The total number of blocked requests that Sightline presented at authentication.
- Post authentication: The total number of blocked requests that Sightline presented to visitors after they logged in.
Soft mitigation displays visitors and requests that experienced some sort of friction, such as a CAPTCHA, but were not blocked. Sightline uses soft mitigation to learn more about a certain visitor or session to determine whether it is legitimate or not. These statistics are useful for understanding the number of soft mitigation that Sightline presented during your time range.
Soft mitigation statistics only appear if you have Precheck enabled.
- Precheck: The total number of visitors that encountered Precheck during their session.
- Captcha: The total number of requests that Sightline presented with a CAPTCHA.
- General Action Type: The total number of requests Sightline mitigated with a policy rule action.
- Trigger MFA: The total number of requests Sightline mitigated with multi-factor authentication (MFA).
Threat Intelligence
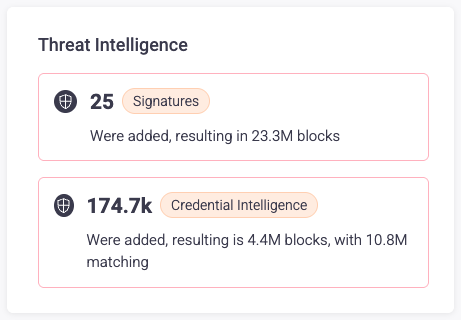
Threat Intelligence tracks new potential threat characteristics that Sightline and HUMAN’s Satori Threat Intelligence Team detected and added to our database. You can also view how many blocked requests or mitigation actions were taken as a result of this new data. This is useful for tracking how Sightline continuously incorporates new threats and applies them to your security.
There are two types of threat intelligence tracked here:
- Signatures added: The total number of new signatures HUMAN detected on your application and added to its database. Signatures are certain traits the HUMAN network identified for specific bots. Sightline also shows how many requests were blocked due to Sightline flagging at least one of these new signatures.
- Credentials Intelligence added: The total number of compromised credentials HUMAN added to its database across HUMAN’s customer network. HUMAN hashes and salts these credentials before it stores them. You can also see the number of blocked requests due to Sightline flagging a request with these credentials and the number of your users’ accounts that match these credentials.
Malicious Traffic
Malicious Traffic summarizes the amount of traffic Sightline blocked and the Attack Profiles associated with these blocked requests within the time range. This is useful for quickly assessing your overall blocked traffic and identifying potential bad actors on your applications. You can also click Open Sightline to navigate directly to the Sightline Threat Tracker.
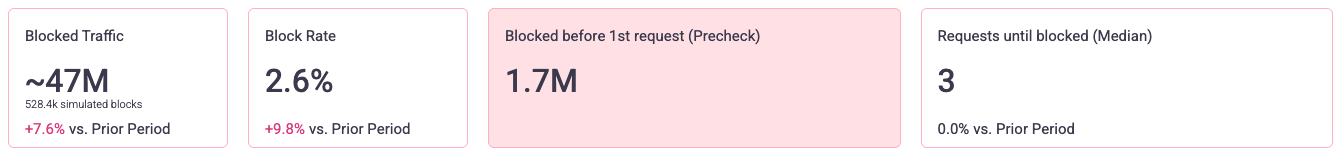
There are four primary statistics at the top of Malicious Traffic:
- Blocked Traffic: The total number of requests Sightline blocked, including simulated blocks. This also shows the change in blocked traffic compared to the last period, which is determined by your selected time range. For example, if you have the last 7 days selected, then Sightline will compare to the 7 days before that.
- Block Rate: The rate that Sightline blocks traffic. This is calculated as the percentage of blocked requests out of the total requests on your application. This also shows the change in block rate compared to the previous period.
- Blocked before 1st request (Precheck): The number of requests Precheck blocked, which are new bots that attempted to visit your application for the first time.
- Requests until blocked (median): The median number of requests in a malicious session before Sightline blocked it. Sightline considers bots without a session as having zero requests or, if the first request was successful, one request.
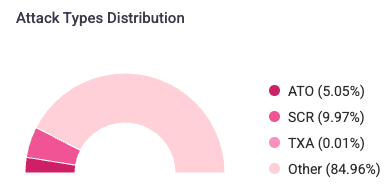
There’s also an Attack Types Distribution chart, which shows the distribution of the types of attacks Sightline detected on your application.
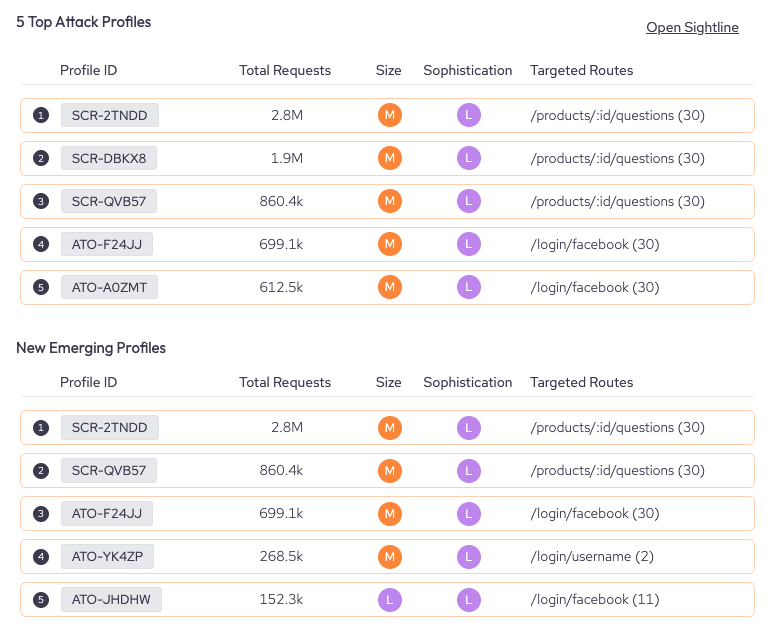
Finally, you can review the 5 Top Attack Profiles and New Emerging Profiles. These list the five most common Attack Profiles with the most requests and five new Profiles with the most requests. This also lists each Profile’s size, sophistication, and the routes they were targeting. For more information, see About Attack Profiles.
Trusted AI Agents & Bots Management
The Trusted AI Agents & Bot Management section shows the most common or recently detected trusted AI agents and bots. This is useful for identifying which known agents and bots are most common on your applications as well as ensuring they are operating on the paths you expect.
Trusted AI Agents
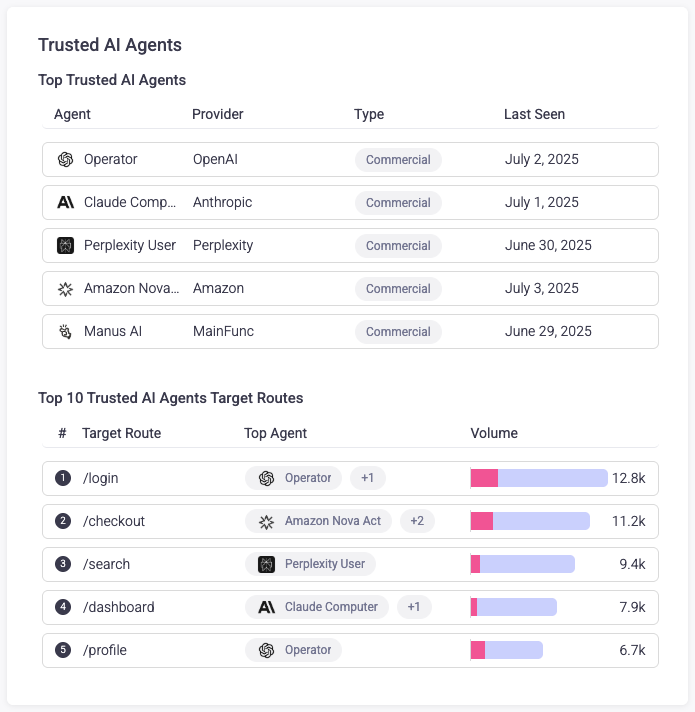
Trusted AI Agents summarizes information about common AI agents that visit your applications and where they’re active.
- Top Trusted AI Agents: Lists the five most common AI agents, their provider, type, and the date that Sightline last detected them. You can click on Top Trusted AI Agents to navigate directly to the AI Agents Monitoring dashbard.
- Top 10 Trusted AI Agents Target Routes: Lists the most common routes on your application that the 10 most active AI agents visited. You can also view the volume of bot traffic and legitimate traffic for each route. Click on Top 10 Trusted AI Aagents Target Routes to navigate directly to the AI Agents Monitoring dashbard.
Trusted bots
Trusted bots summarizes information about new trusted bots Sightline detected as well as where trusted bots are commonly active on your applications.
- Newly Seen: Lists the ten most recent bots Sightline detected within your time range. You can quickly review the permissions assigned to the bot, if any. Bots can be allowed or blocked, and the permission states are represented with the following:
 : Dotted outlines with a star represent permissions that you have not set yourself and what Sightline currently uses for the bot. These permissions are based on the default actions recommended by HUMAN.
 : Solid outlines with a star represent permissions that you set that also coincide with HUMAN’s defaults. If HUMAN ever updates its default permissions for this bot, then your selection will stay the same, and this will change to just a solid outline.
 : Solid outlines without a star represent permissions that you set, but do not coincide with HUMANs defaults.
 : This means that this permission is not enabled for the bot.
- Top 10 Trusted Bots Target Routes: Lists the most common routes on your application that the 10 most active trusted bots visited. You can also view the volume of bot traffic and legitimate traffic for each route.

User experience
The User experience section summarizes Sightline’s impact on your users’ experience. This includes latency or the number of user accounts Sightline protected. This is useful for assessing how Sightline directly affects how users interact with your applications.
Accounts Protected
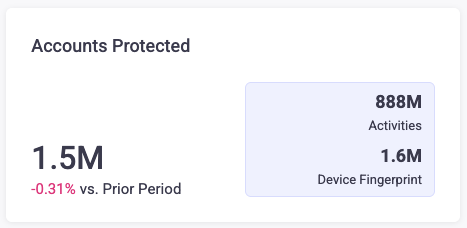
Accounts Protected displays the number of user accounts Sightline protected within the time range. Sightline displays the following statistics:
- Total accounts protected: The total number of accounts protected. This also shows the change in accounts compared to the last period, which is determined by your selected time range. For example, if you have the last 7 days selected, then Sightline will compare to the 7 days before that.
- Activities: The total number of risky activities Sightline detected.
- Device Fingerprint: The total number of device fingerprints Sightline detected.
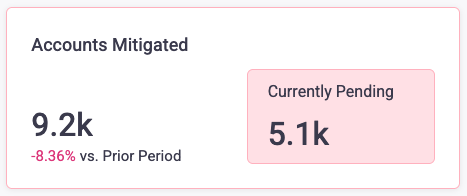
Accounts Mitigated
Accounts Mitigated displays the number of user accounts Sightline mitigated. Sightline displays the following statistics:
- Total accounts mitigated: The total number of accounts mitigated. This also shows the change in accounts compared to the last period, which is determined by your selected time range. For example, if you have the last 7 days selected, then Sightline will compare to the 7 days before that.
- Currently Pending: The total number of mitigated accounts that have not yet been investigated and resolved.