- Filters
- Traffic Over Time
- Traffic types definitions
- Login Attempts Traffic
- Login requests types definitions
- Top 10 Blocked Paths
- Top 10 Incident Types
- CAPTCHA Solved Over Time
- Top 10 Blocked IPs
- Top 10 Known Bots Over Time
- Top 10 Known Bots
- Top Referrers
- Top Domains
- Top ASN Organizations
- Top 10 ASN Organizations Login
- Top 10 Blocked ASN Organizations
- Top Paths
About the Traffic Overview dashboard
Sightline Cyberfraud Defense’s Traffic Overview dashboard summarizes all activity across your applications, including bot activity, legitimate traffic, blocked requests, CAPTCHAs solved, and more. These statistics are separated into different components that you can analyze and filter so you can explore traffic patterns as they occur. Once you see interesting statistics or activity, you can open it in the Investigation dashboard to learn what happened.
Data for graphs and charts are retained for 14 months. Data for tables is retained for 4 months.
You can learn about the Traffic Overview’s statistics and components with this article.
Filters
You can apply filters to all the components in the dashboard. Quick, commonly used filters are at the top. You can also click the ![]() button to add more granular filters to your results.
button to add more granular filters to your results.

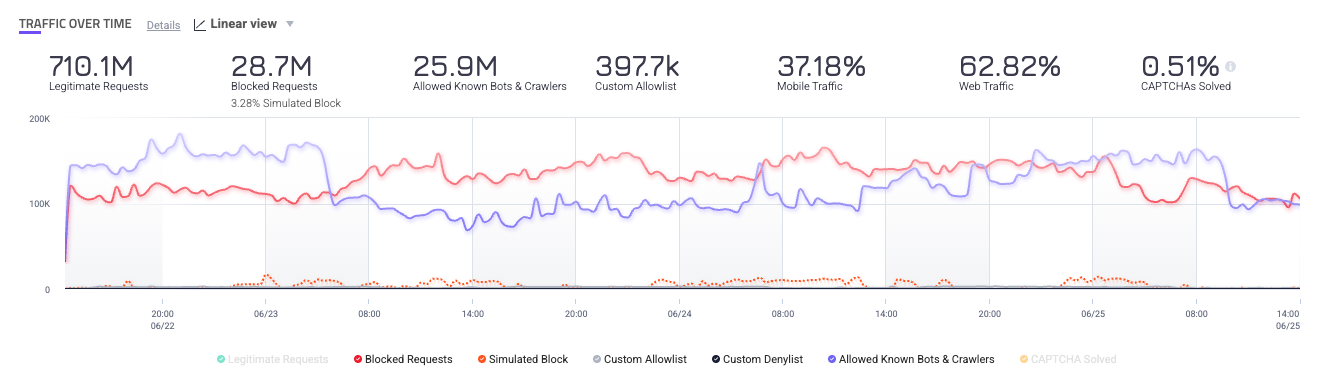
Traffic Over Time
The Traffic Over Time component is a graph of your total traffic activity over time. You can also see brief statistics summarizing this activity at the top of the graph. This graph is a great place to spot interesting or unusual activity, such as unexpected spikes or dips in traffic.
You can adjust the graph between a linear ![]() view or logarithmic
view or logarithmic ![]() view. You can also click each type of traffic at the bottom of the graph to add or remove it from the graph.
view. You can also click each type of traffic at the bottom of the graph to add or remove it from the graph.
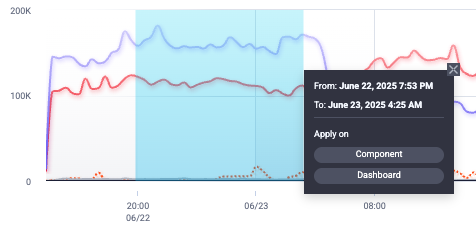
If you want to get a more detailed view of a specific part of the graph, you can click and drag a section to zoom in on it. When you do, you have the option to apply the new time period to just the Traffic Over Time component or across the entire dashboard. If you choose the former, you can refresh ![]() the results to go back to the original view.
the results to go back to the original view.
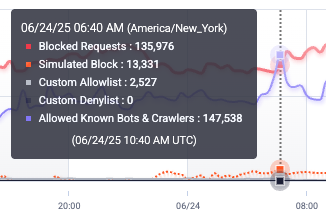
Finally, you can hover over a point in time to get more detailed information about that traffic.
Traffic types definitions
You can find the definitions for each type of traffic below.
- Legitimate Requests: Requests with score outside the set score range. This excludes traffic from Allowed Known Bots & Crawlers and your Custom Allowlist.
- Blocked Requests: Requests that were within the set score range and subsequently blocked by Sightline. This excludes blocked traffic from your Custom Denylist.
- Simulated Block: If your Enforcer is set to Monitor Mode, then this represents requests that would have been blocked if the Enforcer was in Active Blocking Mode.
- Custom Allowlist: Requests that were allowed based on your configured custom policy rules.
- Custom Denylist: Requests that were denied based on your configured custom policy rules.
- Allowed Known Bots & Crawlers: Requests made by known bots and crawlers.
- CAPTCHA Solved: Total number of CAPTCHAs solved.
Login Attempts Traffic
The Login Attempts Traffic component is a graph of your total login attempts over time. Sightline categorizes login attempts as traffic that it detected on pages with some sort of authentication method. The graph also has statistics that summarize this activity for you. This graph is useful for tracking login activity on your applications and spotting any unusual changes to activity, such as sudden spikes or dips.
You can adjust the graph between a linear ![]() view or logarithmic
view or logarithmic ![]() view. You can also click each type of traffic at the bottom of the graph to add or remove it from the graph.
view. You can also click each type of traffic at the bottom of the graph to add or remove it from the graph.

Similar to the Traffic Over Time component, you can click and drag over a specific time period on the graph to zoom in on it. You can also hover over a point to see more details about traffic at that specific time.
Login requests types definitions
You can find the definitions of each type of login request below.
- Legitimate Requests: Requests with score outside the set score range. This excludes traffic from your Custom Allowlist.
- Blocked Requests: Requests that were within the set score range and subsequently blocked by Sightline. This excludes blocked traffic from your Custom Denylist.
- Simulated Block: If your Enforcer is set to Monitor Mode, then this represents requests that would have been blocked if the Enforcer was in Active Blocking Mode.
- Custom Allowlist: Requests that were allowed based on your configured custom policy rules.
- Custom Denylist: Requests that were denied based on your configured custom policy rules.
Top 10 Blocked Paths
The Top 10 Blocked Paths component is a table of the 10 unique paths on your applications that have the most blocked traffic. This is useful for viewing where bots are commonly going to on your applications.
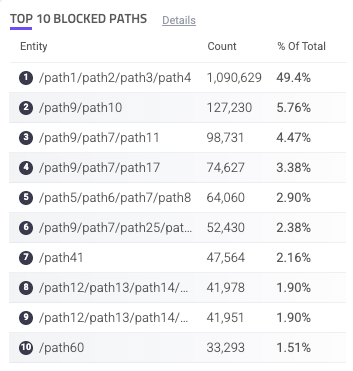
Each path is listed with the count of blocked requests and the % of total blocked requests overall. You can hover over a path to copy ![]() it to your clipboard. You can also click on an entry to search for it. This navigates you to the Analyzer, which is where you can investigate traffic and activity related to the path in more detail.
it to your clipboard. You can also click on an entry to search for it. This navigates you to the Analyzer, which is where you can investigate traffic and activity related to the path in more detail.
Top 10 Incident Types
The Top 10 Incident Types component is a chart that shows the distribution of different incident types on your applications. This is useful for seeing which incidents are most common, and if there’s a sudden change in a type’s distribution, it might be worth investigating.
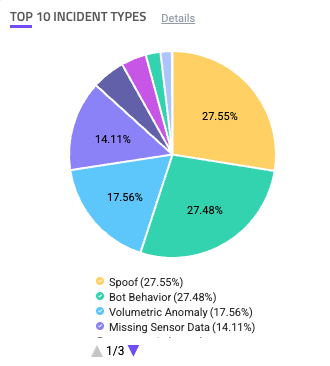
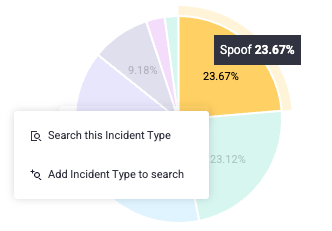
You can click each type of incident type in the legend to add or remove it from the chart. If you click the incident type in the chart, you can choose to search for it. This navigates you to the Analyzer, which is where you can investigate traffic and activity related to incident type in more detail.
CAPTCHA Solved Over Time
The CAPTCHA Solved Over Time component is a graph that shows the number of CAPTCHAs your users solved on your applications over time. This is useful for tracking how well humans are solving your CAPTCHAs compared to bots, especially after you make adjustments to your CAPTCHA.
You can adjust the graph between a linear ![]() view or logarithmic
view or logarithmic ![]() view.
view.
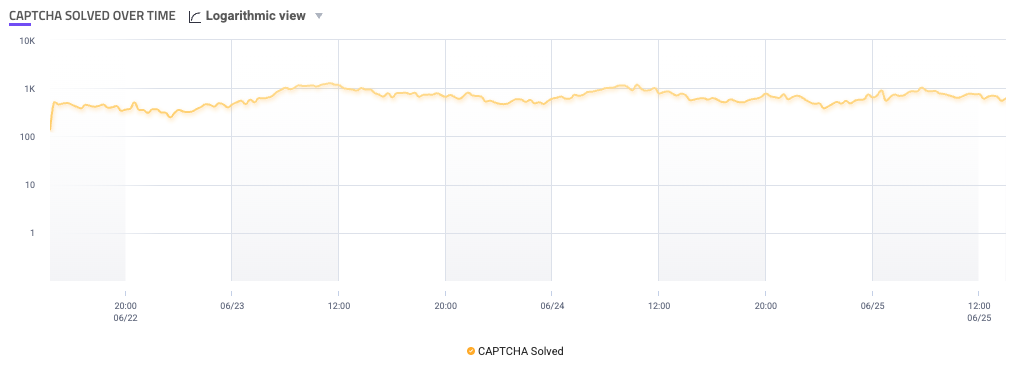
Similar to the Traffic Over Time component, you can click and drag over a specific time period on the graph to zoom in on it. You can also hover over a point to see more details about traffic at that specific time.
Top 10 Blocked IPs
The Top 10 Blocked IPs component is a table of the most blocked IP addresses on your applications.

Each IP is listed with the count of requests from that IP and the % of total requests overall. You can hover over an IP to copy ![]() it to your clipboard. You can also click on an entry to search for it. This navigates you to the Analyzer, which is where you can investigate traffic and activity related to the IP in more detail.
it to your clipboard. You can also click on an entry to search for it. This navigates you to the Analyzer, which is where you can investigate traffic and activity related to the IP in more detail.
Top 10 Known Bots Over Time
The Top 10 Known Bots Over Time component is a graph that shows the most common known bots’ activity on your applications over time. Sightline identifies these known bots based on HUMAN’s list of known bots and crawlers.
You can adjust the graph between a linear ![]() view or logarithmic
view or logarithmic ![]() view. You can also click each type of bot at the bottom of the graph to add or remove it from the graph.
view. You can also click each type of bot at the bottom of the graph to add or remove it from the graph.
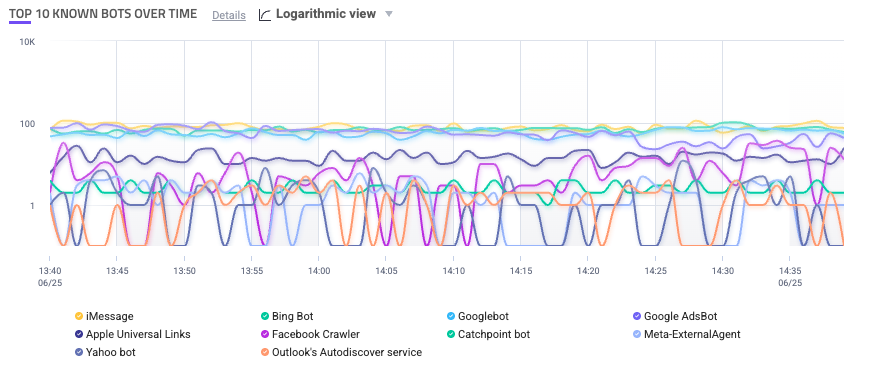
Similar to the Traffic Over Time component, you can click and drag over a specific time period on the graph to zoom in on it. You can also hover over a point to see more details about traffic at that specific time.
Top 10 Known Bots
The Top 10 Known Bots component is a table of the 10 most common known bots on your application.
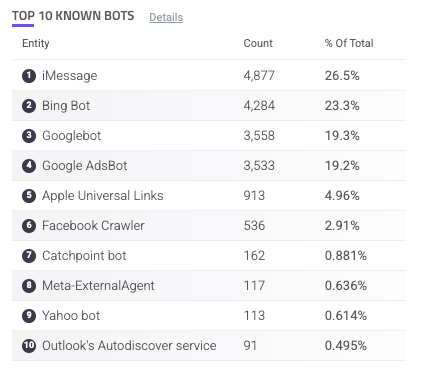
Each entry has a count of activity done by each bot as well as its % of total known bots. You can hover over a bot to copy ![]() it to your clipboard. You can also click on an entry to search for it. This navigates you to the Analyzer, which is where you can investigate traffic and activity related to the bot in more detail.
it to your clipboard. You can also click on an entry to search for it. This navigates you to the Analyzer, which is where you can investigate traffic and activity related to the bot in more detail.
Top Referrers
The Top Referrers component is a table of the most common referrers to your applications. Sightline detects a referrer based on the value it finds in the Referrer header of each request. This can be useful for learning where your traffic is coming from. If there’s a referrer you don’t recognize, it might be worth investigating.
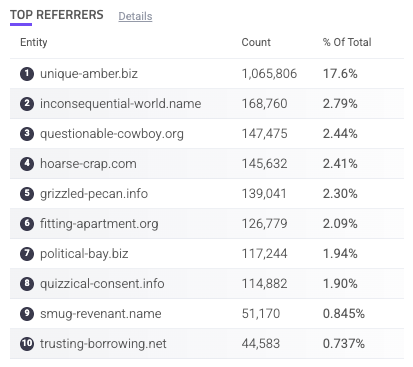
Each referrer is listed with the count of requests from that referrer and the % of total requests overall. You can hover over a referrer to copy ![]() it to your clipboard. You can also click on an entry to search for it. This navigates you to the Analyzer, which is where you can investigate traffic and activity related to the referrer in more detail.
it to your clipboard. You can also click on an entry to search for it. This navigates you to the Analyzer, which is where you can investigate traffic and activity related to the referrer in more detail.
Top Domains
The Top Domains component is a table of the domains that receive the most traffic in your applications. This is useful for tracking where your activity tends to be. If there’s a new domain with unusual amounts of activity in this list, it might be worth investigating.
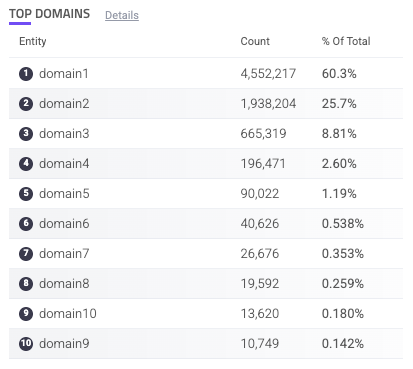
Each domain is listed with the count of requests on that domain and the % of total requests of all your applications that came from the domain. You can hover over a domain to copy ![]() it to your clipboard. You can also click on an entry to search for it. This navigates you to the Analyzer, which is where you can investigate traffic and activity related to the domain in more detail.
it to your clipboard. You can also click on an entry to search for it. This navigates you to the Analyzer, which is where you can investigate traffic and activity related to the domain in more detail.
Top ASN Organizations
The Top ASN Organizations component is a table of the most common Autonomous System Numbers (ASNs) that your traffic comes from. If there’s a new ASN with unusual amounts of activity in this list, it might be worth investigating.
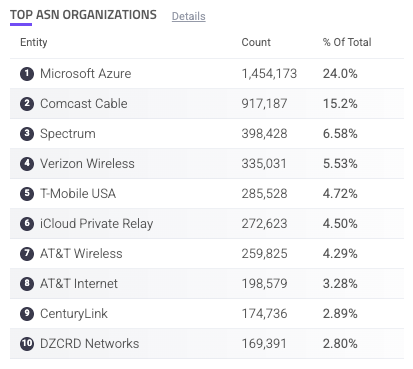
Each ASN is listed with the count of traffic from that ASN and the % of total requests of all your applications that came from that ASN. You can hover over an ASN to copy ![]() it to your clipboard. You can also click on an entry to search for it. This navigates you to the Analyzer, which is where you can investigate traffic and activity related to the ASN in more detail.
it to your clipboard. You can also click on an entry to search for it. This navigates you to the Analyzer, which is where you can investigate traffic and activity related to the ASN in more detail.
Top 10 ASN Organizations Login
The Top 10 ASN Organizations Login component is a table of the most common ASNs that your login-related traffic comes from. If there’s a new ASN with unusual amounts of activity in this list, it might be worth investigating.
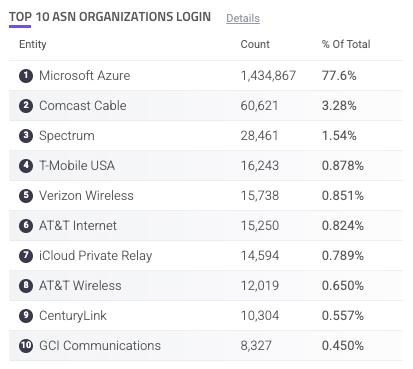
Each ASN is listed with the count of traffic from that ASN and the % of total login requests of all your applications that came from that ASN. You can hover over an ASN to copy ![]() it to your clipboard. You can also click on an entry to search for it. This navigates you to the Analyzer, which is where you can investigate traffic and activity related to the ASN in more detail.
it to your clipboard. You can also click on an entry to search for it. This navigates you to the Analyzer, which is where you can investigate traffic and activity related to the ASN in more detail.
Top 10 Blocked ASN Organizations
The Top 10 Blocked ASN Organizations component is a table of the most common ASNs with blocked requests. If there’s a new ASN with unusual amounts of activity in this list, it might be worth investigating.
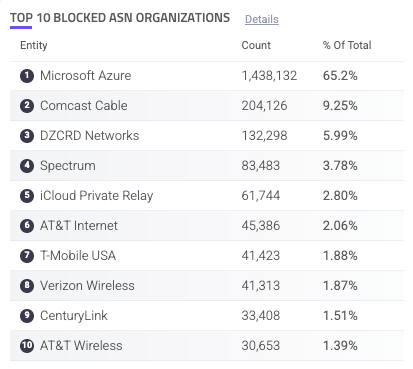
Each ASN is listed with the count of blocked traffic from that ASN and the % of total blocked requests of all your applications that came from that ASN. You can hover over an ASN to copy ![]() it to your clipboard. You can also click on an entry to search for it. This navigates you to the Analyzer, which is where you can investigate traffic and activity related to the ASN in more detail.
it to your clipboard. You can also click on an entry to search for it. This navigates you to the Analyzer, which is where you can investigate traffic and activity related to the ASN in more detail.
Top Paths
The Top Paths component is a table of the paths that receive the most traffic in your applications. This is useful for tracking where your activity tends to be. If there’s a new path with unusual amounts of activity in this list, it might be worth investigating.
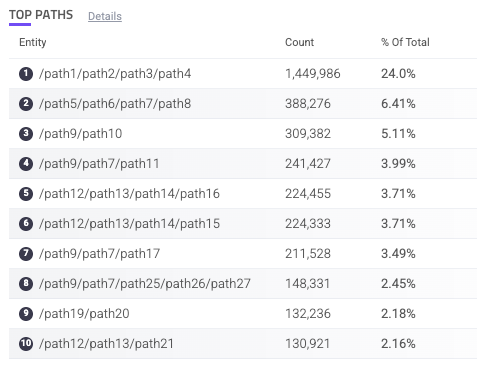
Each path is listed with the count of requests on that path and the % of total requests of all your applications that came from the path. You can hover over a path to copy ![]() it to your clipboard. You can also click on an entry to search for it. This navigates you to the Analyzer, which is where you can investigate traffic and activity related to the path in more detail.
it to your clipboard. You can also click on an entry to search for it. This navigates you to the Analyzer, which is where you can investigate traffic and activity related to the path in more detail.