About the Traffic Analyzer
Sightline Cyberfraud Defense’s Traffic Analyzer lets you investigate activity primarily from the Traffic Overview dashboard. It has a powerful search, filters, and components that expose a variety of traffic characteristics and identifiers to help you examine traffic you’re interested in. The Analyzer is best for learning more about unusual traffic or searching for specific request identifiers. You can find the Traffic Analyzer from Sightline Cyberfraud Defense > Investigate > Traffic Analyzer.
You can learn more about the components and data available in the Traffic Analyzer in this article. For more on investigation, see Investigate with the Traffic Analyzer.
Search
The Search ![]() bar lets you search for specific traffic characteristics such as the block ID, VID, path, a known bot, and others. You can also search for any custom parameters you’ve created. This is useful for finding information on a very specific request, visitor, or type of traffic. Search queries apply to the entire Traffic Analyzer dashboard.
bar lets you search for specific traffic characteristics such as the block ID, VID, path, a known bot, and others. You can also search for any custom parameters you’ve created. This is useful for finding information on a very specific request, visitor, or type of traffic. Search queries apply to the entire Traffic Analyzer dashboard.
Filters
The Filters let you narrow down the data that the Analyzer displays. There are two types of filters. The first type are the data source filters, which determine the traffic data the Traffic Analyzer displays.
You cannot filter for more than two weeks in the Time Range.
![]()
The second are traffic filters, which you can add from the filters ![]() menu. This lets you filter by different traffic characteristics such as the type of browser used, OS, the country of origin, and more.
menu. This lets you filter by different traffic characteristics such as the type of browser used, OS, the country of origin, and more.
Traffic Over Time
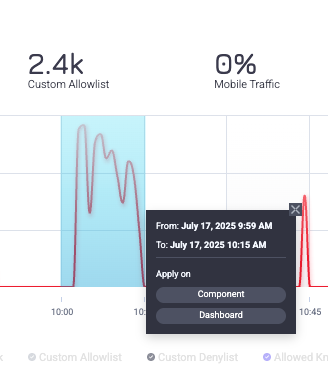
The Traffic Over Time graph is a timeline of your traffic based on your current filters. It separates and displays different types of traffic, such as legitimate requests or blocked requests. You can add or remove these from view by clicking on the corresponding traffic type at the bottom of the graph.
This graph is particularly useful for tracking traffic behavior over time. For example, if you notice a spike in blocked traffic, that likely indicates there was increased bot activity during that time, and you can investigate during that time period further. Alternatively, if you search for specific identifiers such as a block ID, this graph can be useful for tracking when that ID was blocked or allowed.
You can click and drag over a specific section of the graph to expand the activity at that time. You can apply this to just the Traffic Over Time component or apply the new time period to the entire dashboard.
Incident Types
The Incident Types component shows the distribution of bot incidents as categorized by Sightline. This is useful for identifying the type of malicious activity that occurred.
You can hover over each type of incident or refer to the legend to see the specific percentage values for each incident type. You can click on an incident to search for it or add it to your search parameters. The available incident types are:
Top Countries
The Top Countries component shows the distribution of countries the traffic originated from. This is useful for assessing whether the traffic came from countries you would expect from legitimate traffic. If you see a new country with a high amount of traffic, that might indicate there was malicious traffic originating from that country.
You can hover over each country or refer to the legend to see the specific percentage values for each one. You can also click on a country to add it to your filters.
Cloud Vendors
The Cloud Vendors component lists the most common cloud vendors Sightline detected in your traffic based on your filters. This is useful for tracking and understanding the most common cloud vendors your legitimate traffic uses. If you notice a new vendor appear suddenly, or if there’s a surge in traffic from an existing vendor that you don’t expect, then that may indicate malicious activity.
Services IP Classification
The Services IP Classification component lists the most common IP services that Sightline classified based on your traffic. This is useful for understanding the nature of the IP your traffic is originating from. If there’s a service you typically wouldn’t expect to see, or if there’s a service that has a surge in traffic without a clear explanation, then that may indicate malicious traffic.
Top Paths
The Top Paths component lists the paths on your applications that have the most traffic. This is useful for seeing where the traffic was most active based on your filters. If there’s a new path that’s typically not visited, or if there’s more traffic on certain paths than usual, then that might indicate malicious activity. You can click on a path to search for it or add it to your search parameters.
Top 10 IPs
The Top 10 IPs component lists the top 10 most common IPs traffic originated from. This can help determine whether your traffic originated from IPs that you expect. If there’s a new IP that seems unusual, it may be worth investigating, as it might indicate malicious activity. You can click on an IP address to search for it or add it to your search parameters.
Top User Agents
Top User Agents lists the most common user agents detected in your traffic. This can help determine if your traffic has user agents that you’d typically expect. If there’s an unusual user agent that appears or if there’s more traffic coming from a user agent than usual, that might indicate malicious activity. You can click on a user agent to search for it or add it to your search parameters.
Header Referrers
The Header Referrers chart shows the distribution of the most common referrers across all of your traffic. This is useful for understanding what website, if any, that your traffic came from. If there’s a referrer that you typically wouldn’t expect, that might indicate malicious activity. Similarly, if there’s a referrer that commonly appears, but it suddenly has an unusual amount of traffic coming from it, that may indicate bot behavior. You can click on a header referrer to search for it or add it to your search parameters.
Top 10 ASN Organizations
The Top 10 ASN Organizations component lists the top 10 most common ASNs your traffic originated from. This can help determine whether your traffic originated from ASNs that you expect. If there’s a new ASN that seems unusual, it may be worth investigating, as it might indicate malicious activity. You can click on an ASN address to search for it or add it to your search parameters.
Activity Timeline
The Activity Timeline is a log of all requests that match your current filters. Each request comes with forensics that you can use to learn why it was blocked or allowed. You can edit ![]() these columns with the provided values or by your custom parameters. You can also download
these columns with the provided values or by your custom parameters. You can also download ![]() the timeline as a CSV file for your own use.
the timeline as a CSV file for your own use.
If you frequently download this data, we recommend configuring an automatic data export instead.