Integrations
Access the Integrations page via the following link to the HUMAN Portal.
Integrations
A welcome screen shows all available integrations and the configured integrations for the selected customer account.
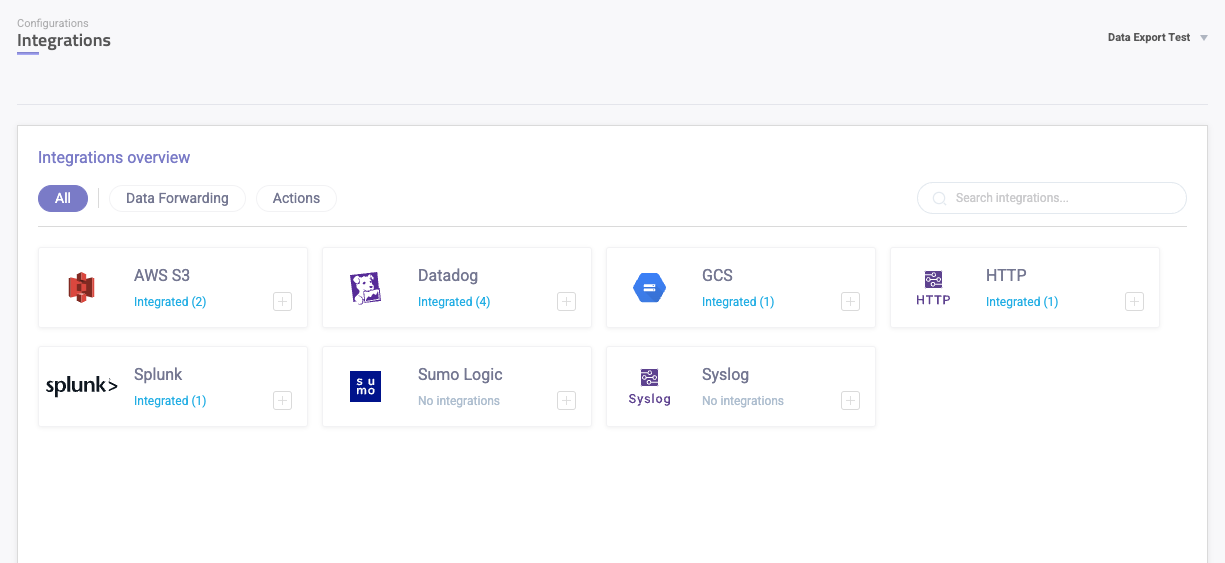
Existing Integrations
By clicking an integration, a right panel will expose all configured integrations and if it’s being used.
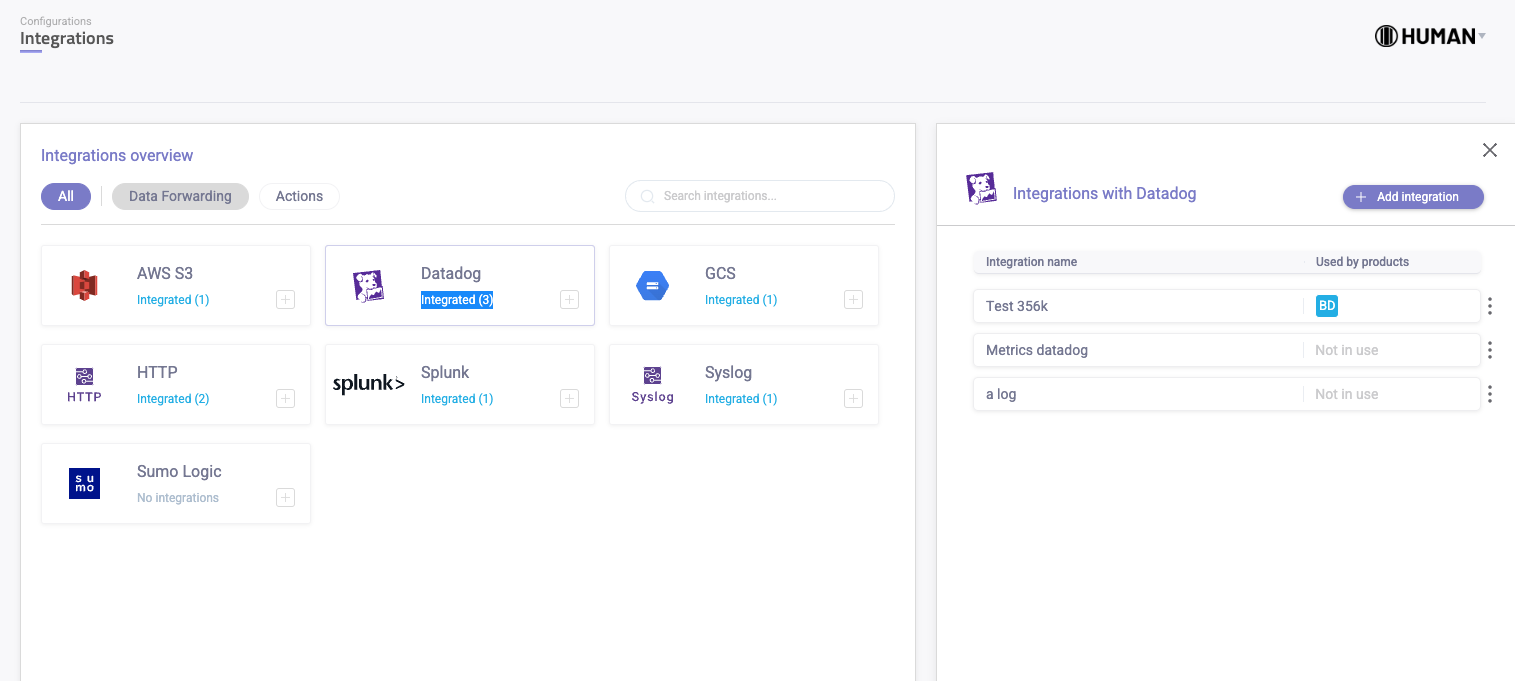
Configure an Integration
By adding a new integration, or selecting an existing integration, you will be routed to the integration details page. In this page you will be able to configure the integration as follows:
Integration Display Name
In the Integration name field give a custom descriptive name to your integration.

Integration Setup
Authentication method can be either:
Public - No authentication (no further actions required)
WAF - Web Application Firewall, meaning the required endpoint is behind a firewall. To enable access to HUMAN, please add the listed IPs to the firewall’s whitelist.

Available Integrations
Datadog
We support sending both Metrics and Logs data schemes to Datadog. For additional information on this integration go to Datadog Integration.
For the datastream type Metrics, only Authentication method - Public - No authentication, is supported.

- API Key - DataDog provided API Key
- Type - Logs or Metrics
- Endpoint URL - The URL based on the Logs or Metrics, Region and Version
Email to Consumer
This integration lets you connect your organization’s email domain and create email mitigation actions that automatically triggers when your Policy Rules are met. To add this integration:
- Provide your Sendor Domain that you would like to send emails from.
- Click Generate DNS Records & Save.
- Install the provided DNS records with your provider, then check the Verify you installed these DNS records box.
- Click Verify Installation. This verifies your DNS records were properly configured.
- Click Save changes.
HTTP Web Hook
Support sending only the Logs data scheme.
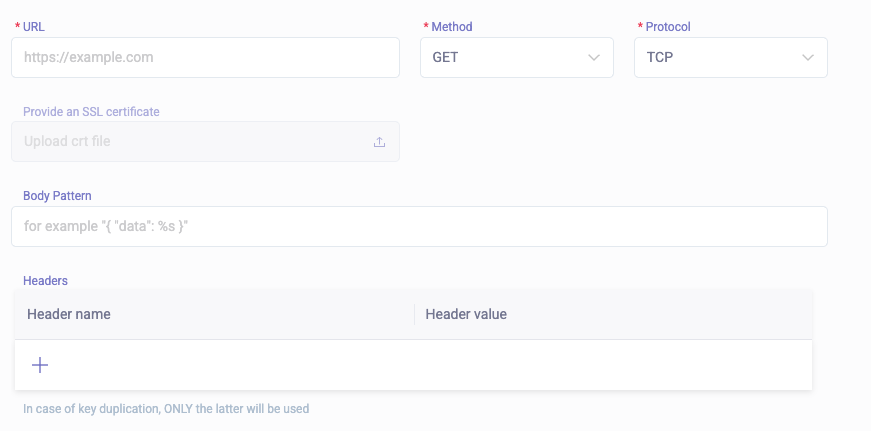
- URL - The http endpoint url
- Method - Http method to send the data
- Protocol - TLS or TCP
- SSL certificate - If the protocol is TLS, please upload the certificate to allow a secure connection
- Body pattern -
{ "data": %s }. If the data sent needs to be in a very specific format. Use %s as a “data” placeholder - Headers - API keys, authentication headers, custom headers - can all be set here
Splunk HTTP Event Collector (HEC)
We support sending both Metrics and Logs data schemes to Splunk Cloud and enterprise through the HTTP Event Collector (HEC).
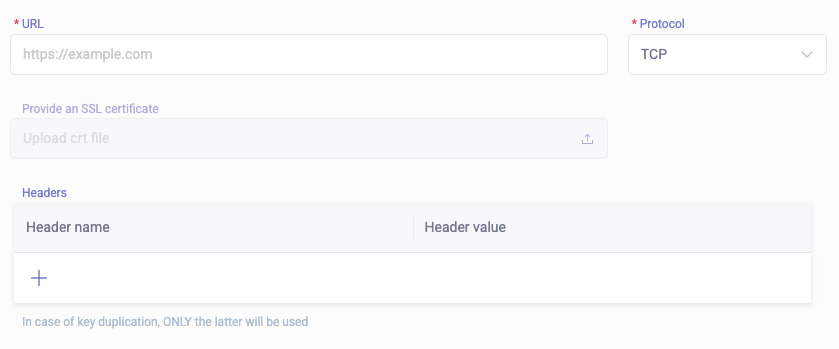
- URL - A url to connect to Splunk
- Protocol - TLS or TCP
- SSL certificate - If the protocol is TLS, please upload the certificate to allow a secure connection
- Headers - Usually “Authorization” header
AWS S3
Support sending only the Logs data scheme.
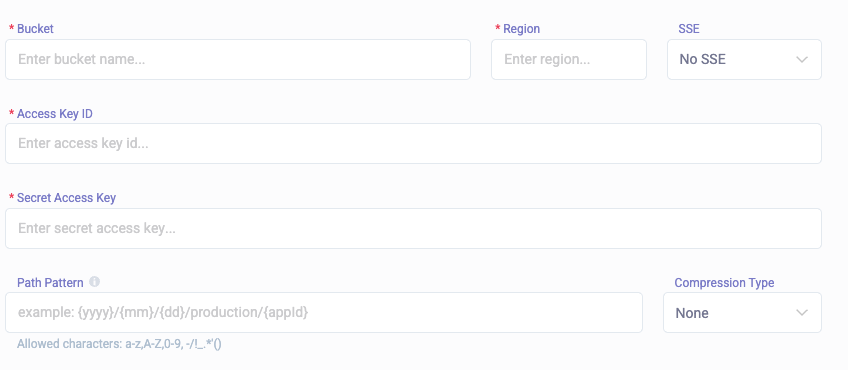
- Bucket - The name of the receiving S3 bucket
- Region - AWS region the bucket resides at
- SSE - Bucket encryption method
- Access key id - Bucket access key id
- Secret access key - Bucket secret access key
- Path pattern - file’s path (does not affect file name). Supported patterns:
path pattern example (for date 16.02.2022) - {yyyy}/{mm}/{dd}/production/{appid} -> 2022/02/16/production/HUMAN1q2w3e4r
Allowed characters: a-z,A-Z,0-9, -/!\_.\*'()
**file name example - 7bd6079a-b5e4-4788-93c5-b939549ce5be\_HUMAN3tHq532g\_1645014120000000000\_1645014180000000000**
- Guid - 7bd6079a-b5e4-4788-93c5-b939549ce5be
- AppId - HUMAN1q2w3e4r
- From timestamp (UNIX epoch) - 1645014120000000000
- To timestamp (UNIX epoch) - 1645014180000000000
SumoLogic
Support sending only the Logs data scheme with POST requests.

Please provide url that contains the api endpoint and unique collector code of the format. You can get this url from your Sumologic dashboard.
Syslog
Support sending only the Logs data scheme.

- URL - Endpoint host
- Port - Endpoint port
- Protocol - TLS or TCP
- SSL certificate - If the protocol is TLS, please upload the certificate to allow a secure connection
- Expiry date - If the certificate is valid, the date is automatically extracted
- Facility and Severity Levels - See What are Syslog Facilities and Levels?