

Create Custom Data Views
Dive deep into HUMAN-detected trends by creating your own customizable tables and graphs.
For an overview of the Explore page’s reporting, charting, and exporting features, see our Explore Dashboard reference guide.
You can create custom views of your data on the Explore page of the HUMAN Dashboard to visualize the traffic data analyzed by each of HUMAN’s products.
This guide focuses specifically on building and saving your data queries.
Create a data view
Follow these steps to build a new data query.
Create a new view
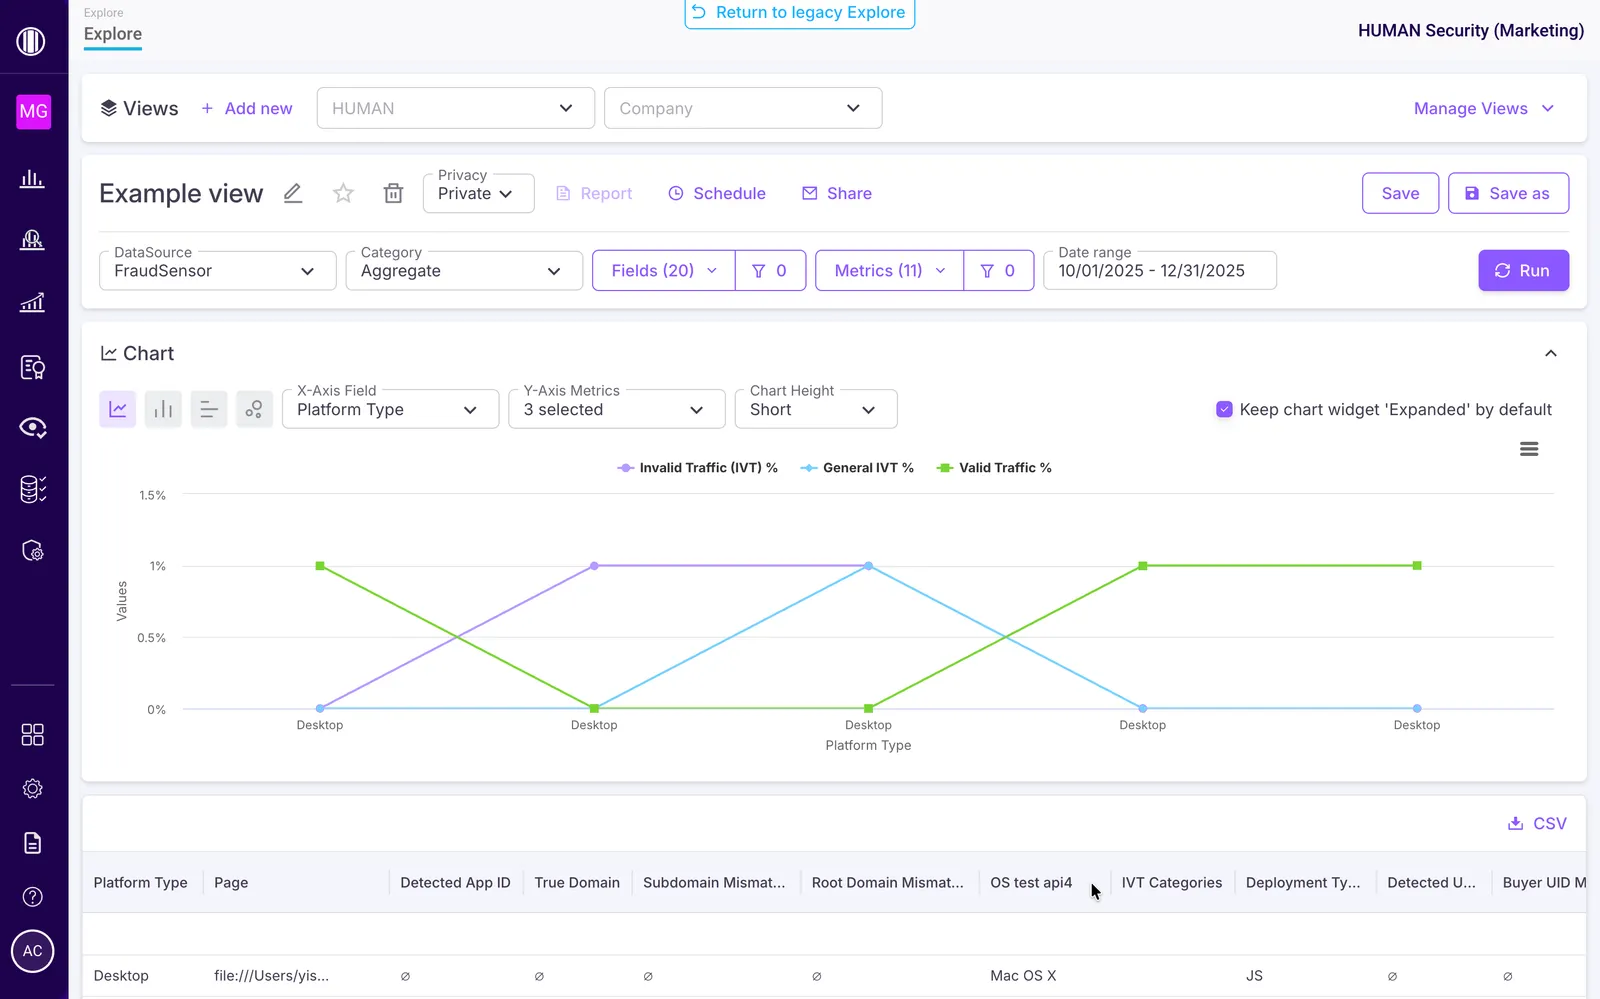
Click + Add new in the view management menu. This generates a template that you can customize.

Configure your view settings & data parameters
Use the view settings and filter bar to build your query. For full definitions of these filters, refer to the Explore Dashboard guide.

Set the following parameters to pull in your desired data:
- View name: Edit the name by clicking the
 button. Choose a name that reflects the function of your view.
 - Privacy: Choose whether to make this view Private (only available to you) or Company (others in your organization can access, clone, and create reports from it).
- DataSource & Category: Select which HUMAN product’s data to include, and choose between Transactional (discrete data points) or Aggregate (general trends) data.
- Fields & Metrics: Choose how your data is grouped (Fields) and measured (Metrics). You can also apply filters
 to narrow down specific campaigns or platforms.
 - Date range: Set the time frame of your view using the preset ranges or the custom calendar.
Run and save the view
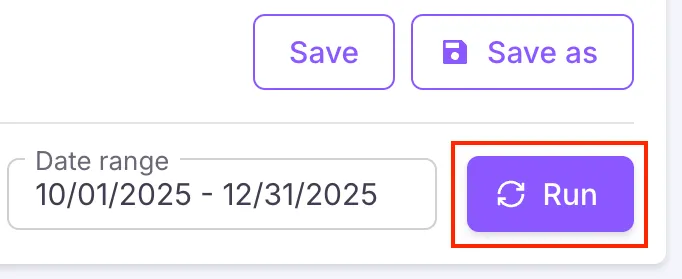
Click Run to fetch the data associated with your parameters. Once the data loads successfully, click Save in the filter bar.
Your data will not automatically update. If you ever make changes to your fields, metrics, or date ranges, you must click Run again to update your data before saving.
Analyze and export your data
Once your view is run and saved, you can use the Explore dashboard’s other widgets to take action on your data:
- Chart Settings: Customize the X and Y axes to visualize trends over time.
- Data Table: Review your traffic summary or download it as a CSV.
- Reports & Alerts: Generate, schedule, or share scalable reports based on your saved view.
For detailed instructions on using these tools, see the Explore Dashboard Guide.
Manage existing views
You can adjust the parameters of an existing data view or use Save as to create and make changes in a copy.
If you update or rename an existing custom view, any saved changes overwrite the old view. This means that if you overwrite a view, you won’t be able to retrieve previous versions of that view.
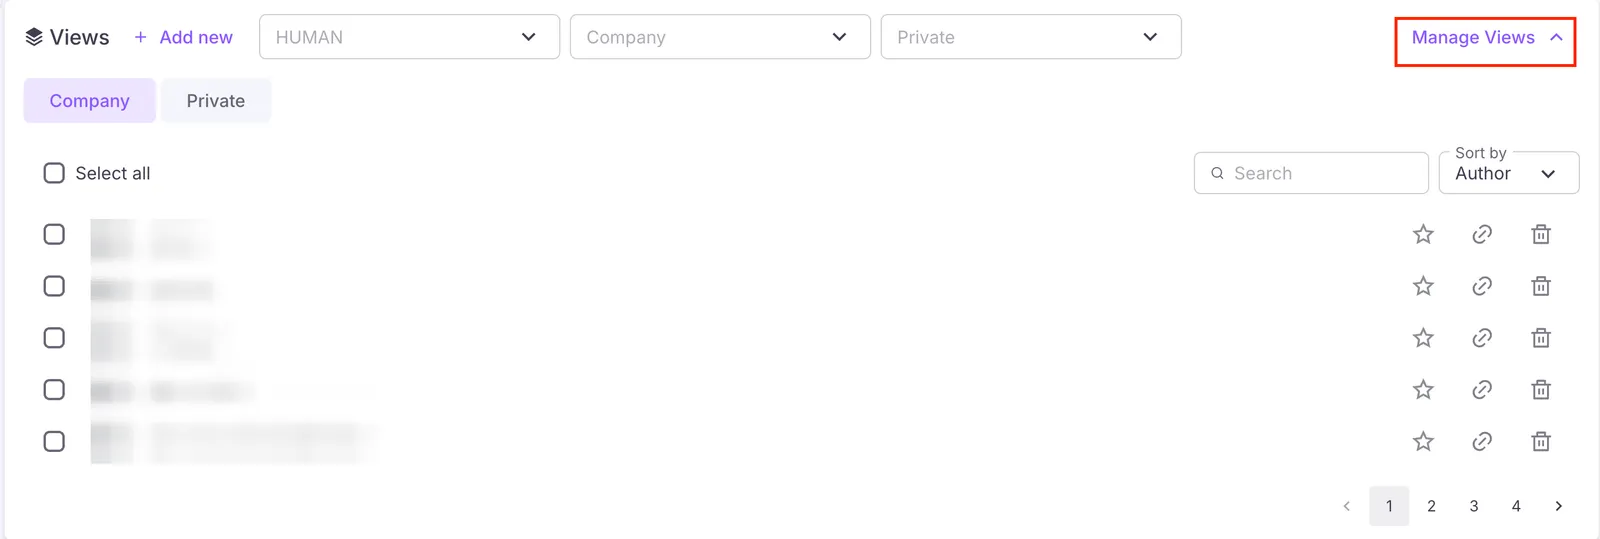
- Select a view from the dropdown menu or select Manage Views to choose from a list of all views.
- Click Save as and give the view a new name. This creates a copy of the chosen view without overwriting the original.
- Make any desired changes to your fields, metrics, or date ranges. Click Run to generate the new data, then select Save.