

About the Threat Intelligence Dashboard
The Threat Intelligence page lets you investigate the characteristics of malvertising on your platform in more depth than the Malvertising Overview. Use the breakdowns and filters to see where risk concentrates. For example, you can see which operating systems or browsers appear most often for threats in a specific country, then prioritize mitigation.
Reference steps 12-15 for a walkthrough of Threat Intelligence.
Dashboard filters
Use the filters at the top of the page to focus the trends and distribution charts:
- Date range: The period you want to analyze.
- Smart Filter: Click Choose to add filters, such as country, DSP, or browser. Then click Filter to apply them. Click Reset to return to the default view.
When you apply a filter, the trend graph and distribution charts update to that slice of your traffic.
Threat attributes
You can evaluate threat activity across these characteristics:
- Threat Class: Attack mechanism categories, such as same-origin redirects or cloaked scripts. See the Threat Library for class and trait definitions.
- Threat Type: Higher-level groupings of threat behavior, such as redirect threats, compromised landing pages, or prohibited ads. You can group related classes under a shared type when you investigate.
- DSP: Demand-side platforms associated with the identified creative threats.
- Device Type: Device profiles associated with the observed threat traffic.
- Operating System: Operating systems associated with the threat traffic.
- Country: Geographic regions associated with the threat traffic.
- Browser: Browsers associated with the threat activity.
Threat trends and distribution
Attribute trend graph
The trend graph tracks threat volume over time for a selected characteristic.
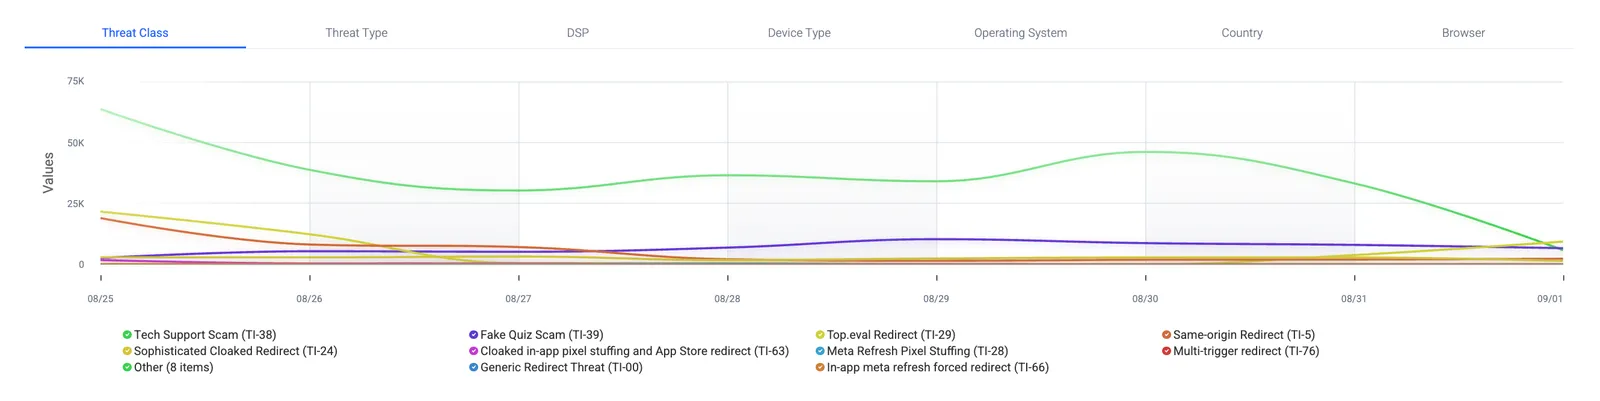
To update the graph view, click any of the attribute tabs across the top of the panel:
- Threat Class
- Threat Type
- DSP
- Device Type
- Operating System
- Country
- Browser
Click a series in the legend to show or hide it if you want to examine a specific category more closely.
Segment distribution breakdown
Breakdown charts show the proportional share of threat traffic within each category, including pie charts. Use them to spot primary risk drivers at a glance.
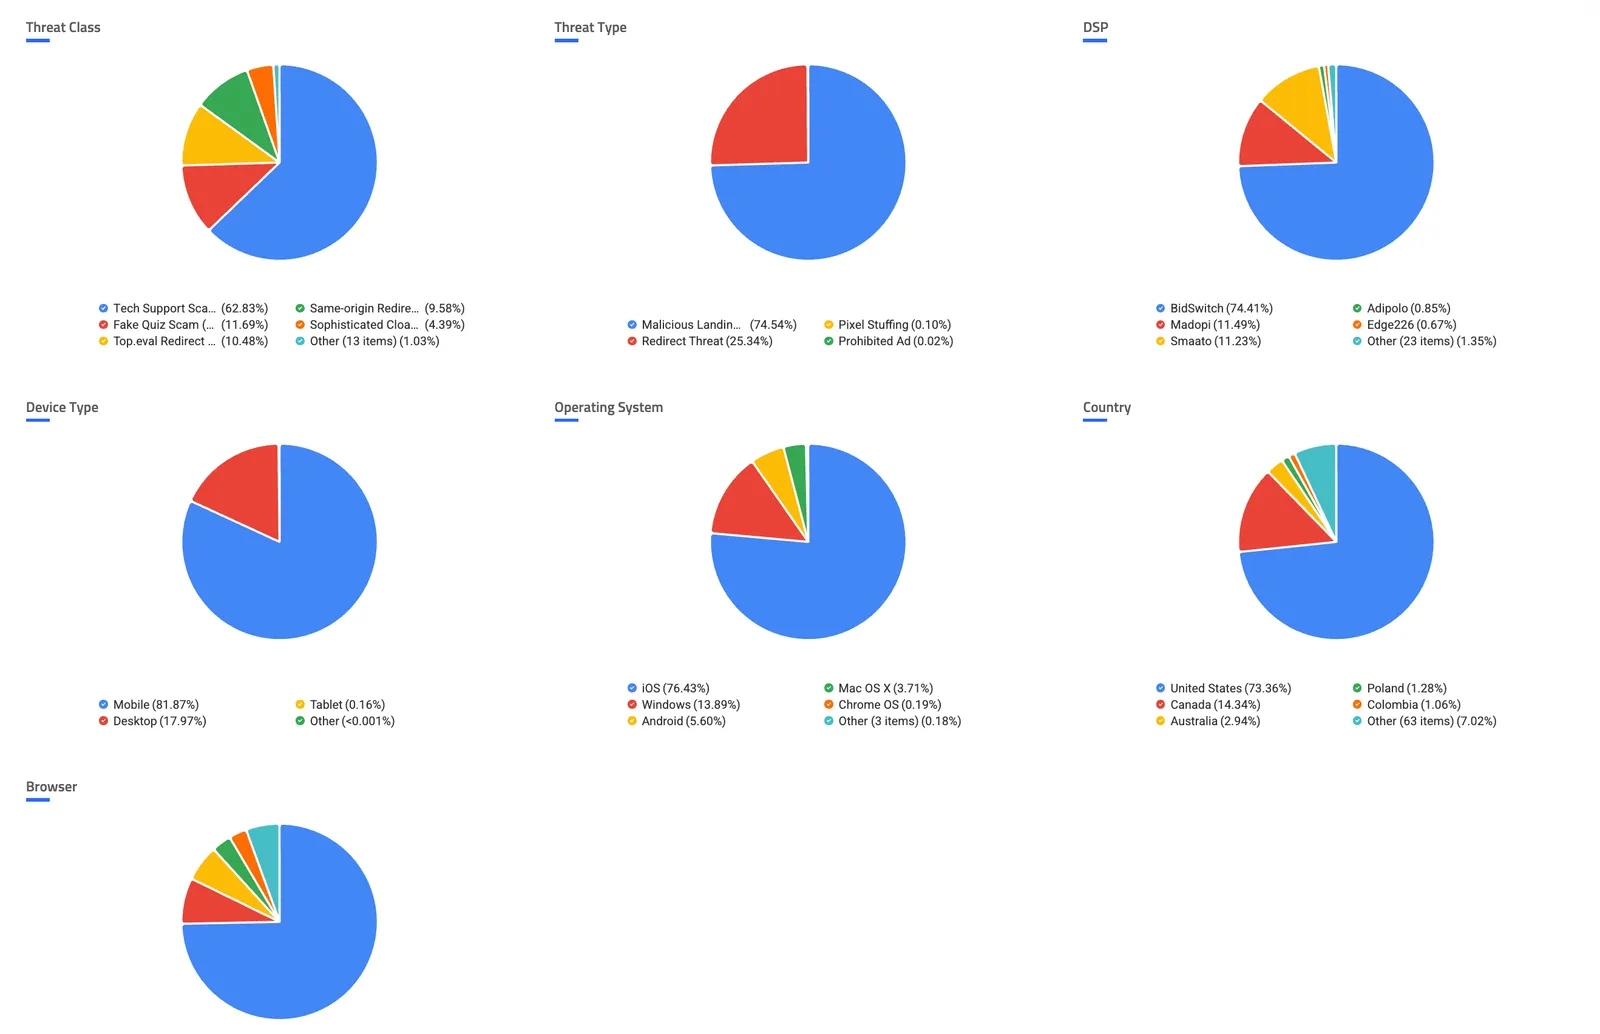
The breakdown charts cover the same attributes as the trend graph:
- Threat Class: Percentage share by specific threat mechanism.
- Threat Type: Percentage share by high-level threat category.
- DSP: Percentage of threat volume by demand-side platform.
- Device Type: Percentage share by device profile.
- Operating System: Percentage share by operating system.
- Country: Percentage share by geography.
- Browser: Percentage share by browser.