

About the Malvertising Overview
The Malvertising Overview page gives you a high-level summary of inventory health for your platform over a selected period. Compare how much traffic and how many creatives were observed, clean, or malicious, then use the trend graph to spot changes over time. Adjust the Date range at the top of the page to refresh the metrics and graphs below.
Reference steps 8-11 for a walkthrough of the Malvertising Overview.
Dashboard metrics
The overview highlights these key indicators:
- Observed Impressions: The total number of impressions analyzed.
- Clean Impressions: The number of impressions free of malicious activity.
- Malicious Impressions: The number of impressions flagged for threats.
- Observed Creatives: The total number of unique creatives analyzed.
- Clean Creatives: The number of unique creatives determined to be safe.
- Malicious Creatives: The number of unique creatives flagged as threats.
Trend graphs
Below the high-level metrics, a line graph shows impressions and creatives together over your selected date range.
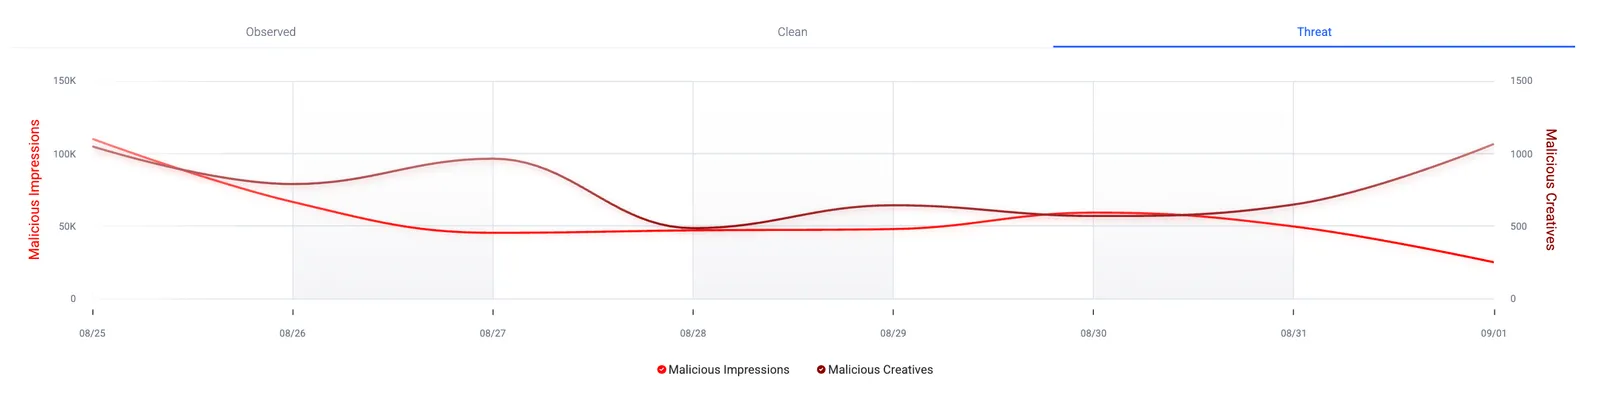
Use the tabs at the top of the graph to switch views:
- Click Observed to view Observed Impressions and Observed Creatives.
- Click Clean to view Clean Impressions and Clean Creatives.
- Click Threat to view Malicious Impressions and Malicious Creatives.
Click a series in the legend to show or hide it if you want to examine a specific category more closely.
For deeper breakdowns by Threat Class, Threat Type, DSP, Device Type, and related attributes, see Threat Intelligence.