

About the AQ Analytics Dashboard
The AQ Analytics page summarizes how creatives for your platform performed against ad quality checks over a selected date range. Use it to track how many creatives were scanned, whether they passed, failed, or were flagged, and which categories or rules drive most issues. Adjust the Date range at the top of the page to refresh the metrics and charts below.
Reference steps 8-13 for a walkthrough of AQ Analytics.
Creative scanning overview
The Creative scanning overview shows high-level scanning metrics for the selected date range.
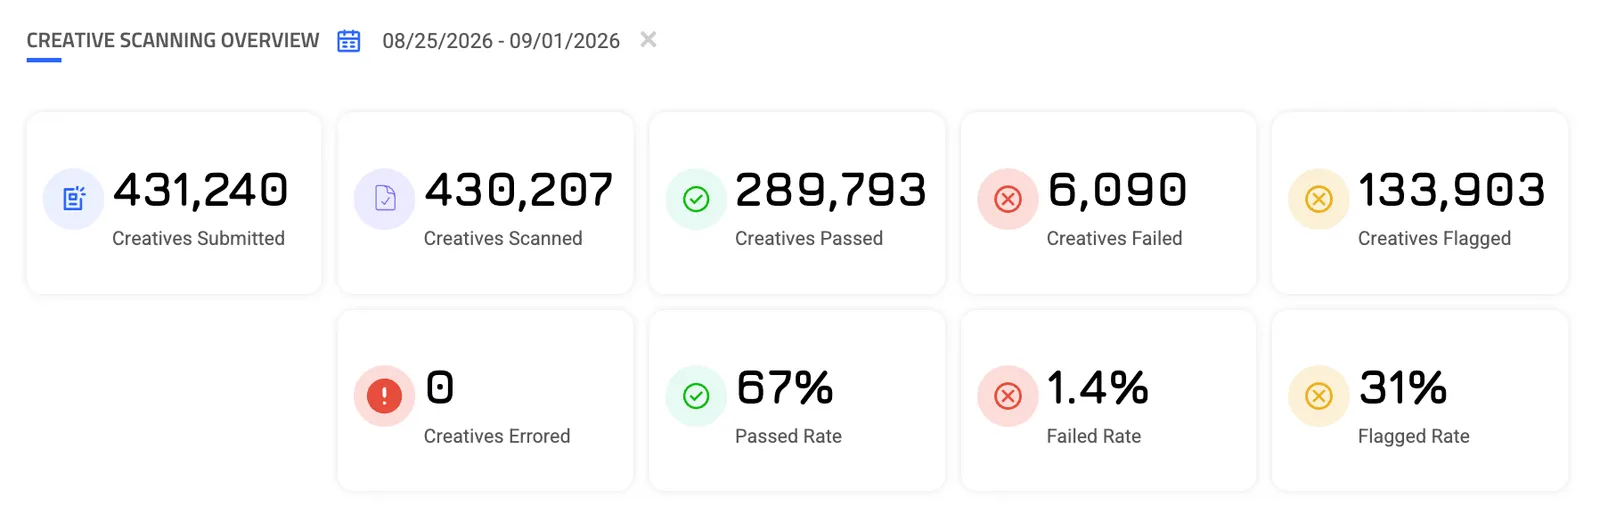
Core metrics
- Creatives Submitted: Total number of creative assets submitted for review.
- Creatives Scanned: Total number of creative assets processed through evaluation.
- Creatives Passed: Number of creatives that met all quality and policy checks.
- Creatives Failed: Number of creatives that failed one or more checks.
- Creatives Flagged: Number of creatives that were flagged based on your rule configuration.
- Creatives Errored: Number of creatives that did not complete evaluation.
- Passed Rate: Percentage of scanned creatives that passed.
- Failed Rate: Percentage of scanned creatives that failed.
- Flagged Rate: Percentage of scanned creatives that were flagged.
Failed creatives trend graph
The Failed creatives graph tracks creative status volume over time across your inventory.
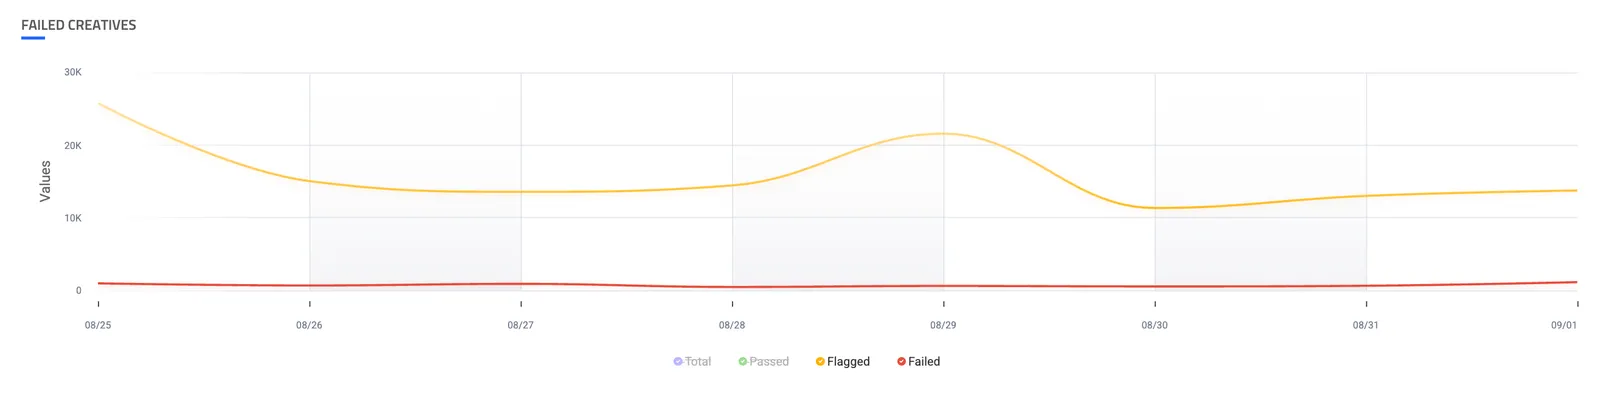
The graph includes these series:
- Total
- Passed
- Flagged
- Failed
Click a series in the legend to show or hide it if you want to examine a specific category more closely.
Status and category distributions
Distribution charts show how creatives break down by overall status and by the categories behind failures and flags.
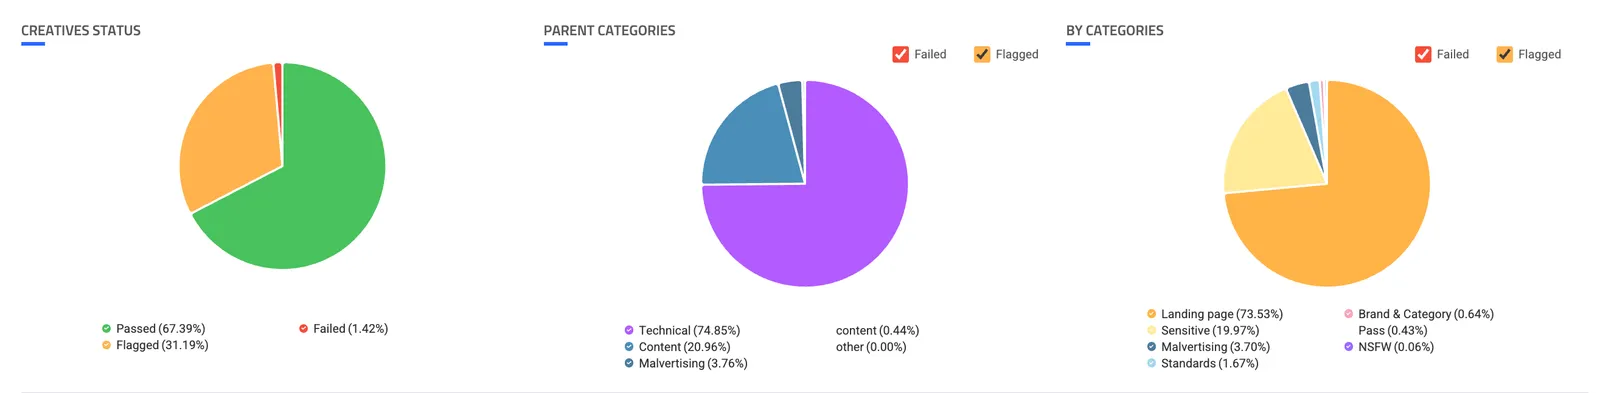
- Creatives Status: Share of creatives marked Passed, Flagged, and Failed.
- Parent Categories: High-level grouping of issues, such as Technical, Content, and Malvertising. You can filter this chart by selecting or clearing the Failed and Flagged checkboxes.
- By Categories: More specific groupings, such as Landing page, Sensitive, Malvertising, Brand and Category, Standards, and NSFW.
Rule violations breakdown
The By Rules chart shows which rules were triggered and whether each trigger counted as Failed or Flagged. The same rule can appear as Failed or Flagged depending on how that rule is configured for your platform.
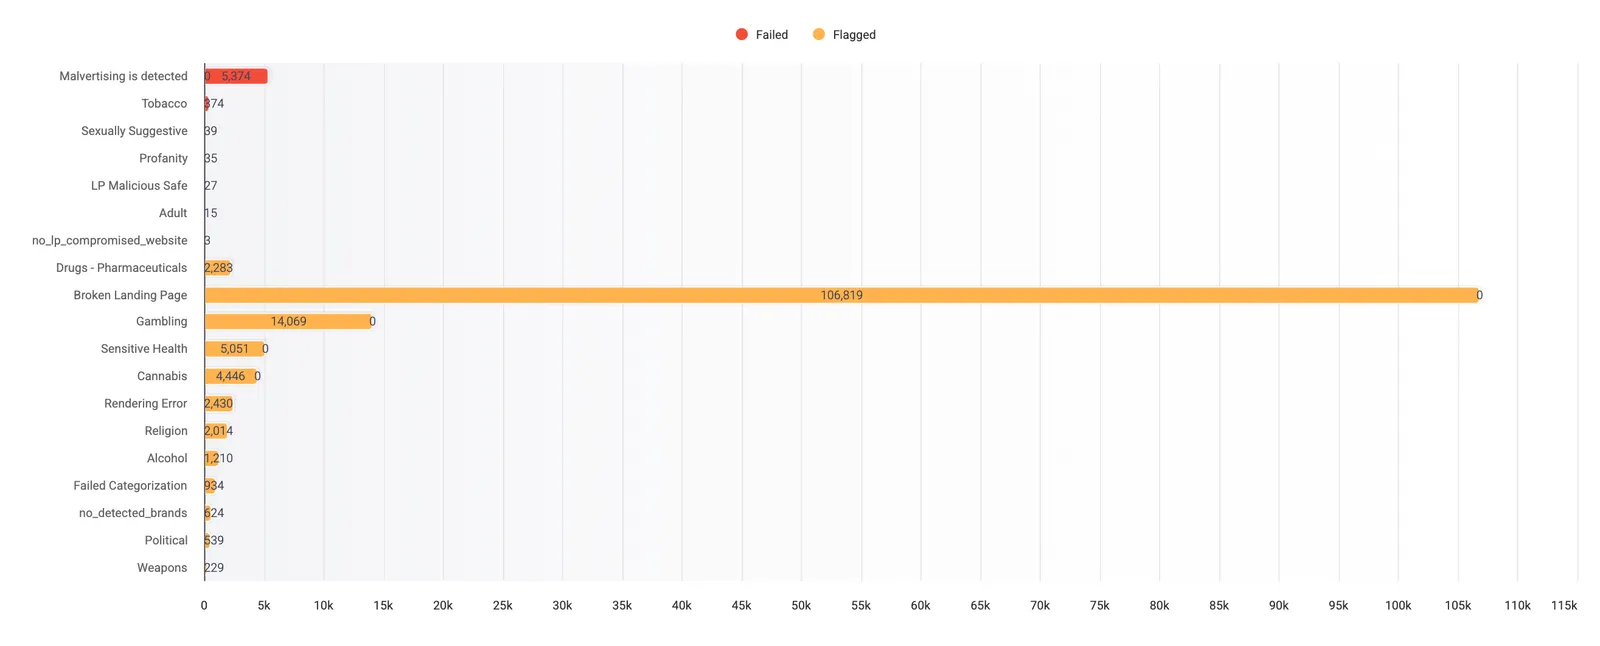
Interpreting rule statuses
- Failed (red): The creative failed the check for that rule, such as Malvertising is detected.
- Flagged (orange): The creative was flagged for that rule, such as Broken Landing Page, Gambling, Sensitive Health, or Drugs - Pharmaceuticals.
Click a series in the legend to show or hide it if you want to examine a specific category more closely.