About the Delivery Statistics Dashboard
The Delivery Statistics page gives you an overview of the inventory and traffic HUMAN observes on your platform, not only malicious creatives. Use it to understand overall volume, unique partners in the delivery path, and how impressions and creatives are distributed across your traffic.
Reference steps 16-18 for a walkthrough of Delivery Statistics.
Dashboard filters
Use the filters at the top of the page to focus the metrics and charts:
- Date range: The period you want to analyze.
- Smart Filter: Click Choose to add filters, such as publisher, distribution, or DSP. Then click Filter to apply them. Click Reset to return to the default view.
Traffic overview and metrics
The overview highlights key indicators for your selected period, such as:
- Observed Impressions: The total number of impressions analyzed.
- Observed Creatives: The total number of creatives analyzed.
- Unique DSPs Observed: How many distinct demand-side platforms (DSPs) appear in your traffic.
- Unique Publishers Observed: How many distinct publishers appear in your traffic.
Trend graphs show how these measures change over time.
Trend graphs
This section displays top-level inventory trends over time. Click a tab at the top of the main graph to switch views:
- Creative Overview: View the trend of Observed Impressions against Observed Creatives.
- DSP Impressions: View impression volume originating from your DSPs.
- DSP Unique Creatives: View unique creative volume associated with specific DSPs.
- Publisher Impressions: View total impression volume delivered across your publishers.
- Publisher Unique Creatives: View unique creative volume distributed across your publishers.
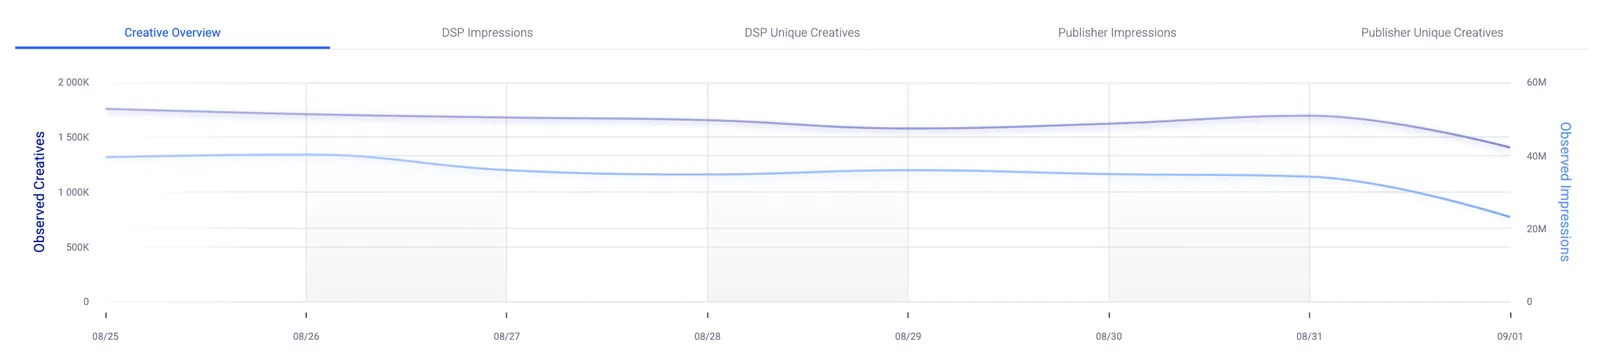
Click a series in the legend to show or hide it if you want to examine a specific category more closely.
Data sampling and impression buckets
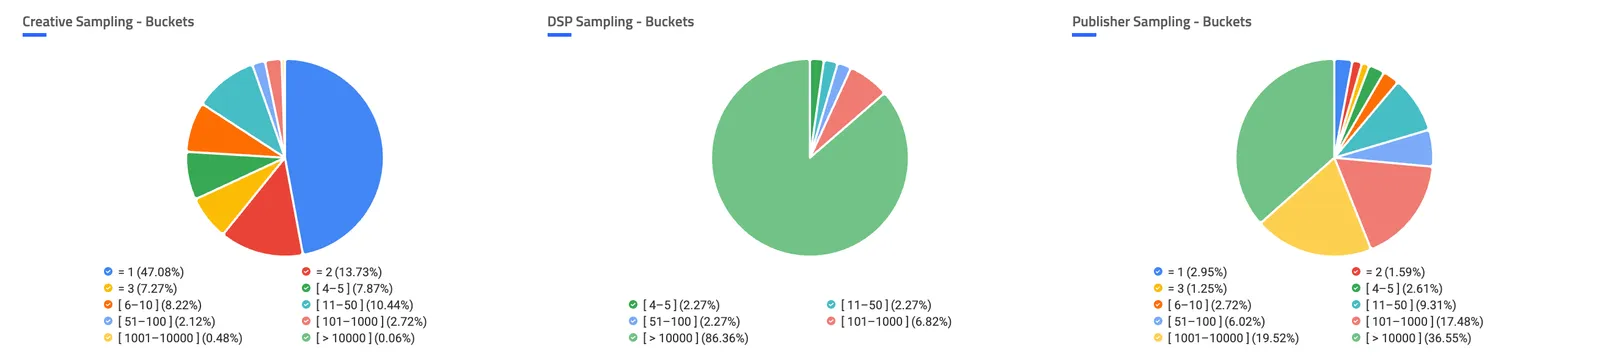
Below the main trend graph, dynamic pie charts break down your traffic into impression volume buckets. These charts categorize your inventory by frequency, including items with one impression, 11 to 50 impressions, 101 to 1,000 impressions, or more than 10,000 impressions, across three areas:
- Creative Sampling - Buckets: Groups of creatives by impression volume.
- DSP Sampling - Buckets: How impression volume is distributed across demand-side platforms.
- Publisher Sampling - Buckets: How impression volume is distributed across publishers.
Impression distribution profiles
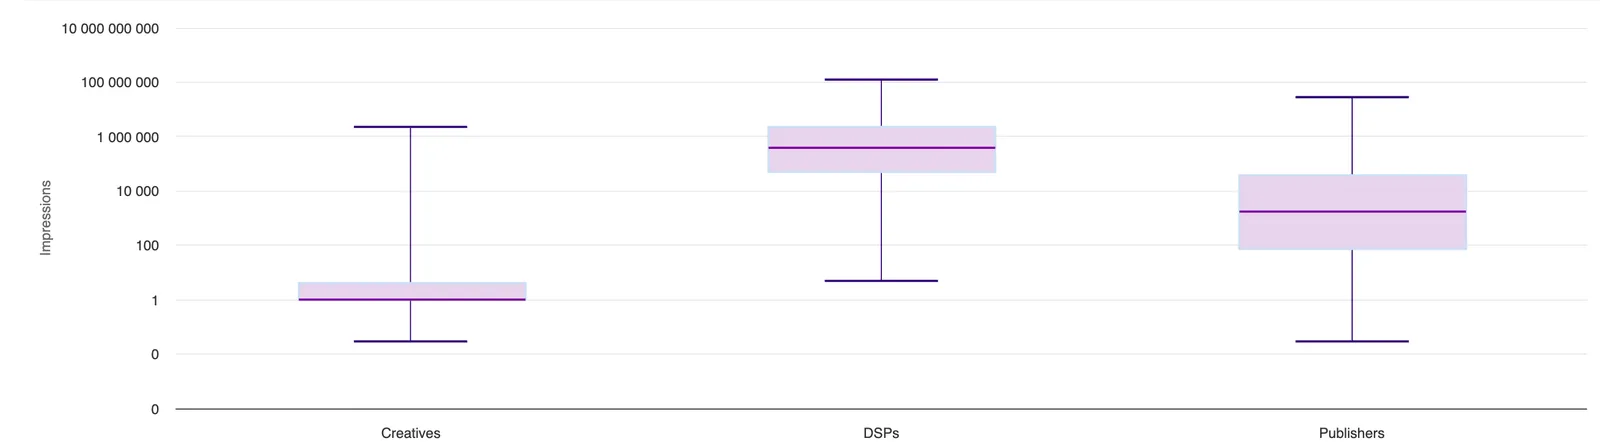
At the bottom of the page, statistical box plots visualize the median, quartiles, and overall distribution of impressions on a logarithmic scale. Use these plots to identify outliers and see where most of your traffic is concentrated across:
- Creatives
- DSPs
- Publishers