Understand the HUMAN Dashboard
The Executive Summary page of the HUMAN Dashboard provides a comprehensive overview of your traffic data. This information is a near real-time summary of HUMAN’s analysis and offers a high-level breakdown of traffic statistics.
Each of HUMAN’s products has its own dedicated Executive Summary page. Certain aspects of these pages are unique to each product (described in the following topics), but there are several common features and functionalities shared among all products.
Data visualizations
Each product’s Executive Summary includes multiple visualizations of the traffic data that meets the conditions of your applied filters. Although the specific data points vary by product, each visualization includes a breakdown of several relevant fields and the data points associated with those fields. You can also view product-specific data in greater detail on the Explore page.
To download the underlying data from a specific visualization, select ![]() in the upper-right corner of that pane. Then select Download data. In the window that appears, you can customize the format and content of the data to be downloaded.
in the upper-right corner of that pane. Then select Download data. In the window that appears, you can customize the format and content of the data to be downloaded.
For more information about the data presented in these visualizations, please consult each product’s dashboard guide.
Filters
You can use filters to customize the data that appears on each product’s Executive Summary page. Specific filters vary by product, but Current Period is used across all products to adjust the time frame of data displayed.
- Select the filters you want to apply to your data.
- Select
 to update the visualization based on your filters. (To go back to the default view at any time, click
  and select Reset filters.)
 - (Optional) If you want to save your selected filter configurations, select Save Filter and assign the filter a name. To apply that filter later, select it from the Select Filter Preset drop-down menu.
Drills
Certain visualizations allow you to drill down on specific data points for expanded information about the events driving that data.
- Select the data point (like a number, percentage, or point on a graph) you want to expand.
- Select a drill option from the Explore menu. The drill opens in a new window with expanded information about that data point.
- (Optional) Customize your drill data with different visualizations and filters (where applicable), download the results of your drill data, or refine your data even further by creating additional drills.
Dashboard alerts
If a visualization includes some form of quantitative data (like a number, percentage, or chart), you can create alerts from that data to notify you if HUMAN detects traffic fluctuations based on customizable criteria.
Any filters you apply later won’t affect your alerts. Filters only change which data is displayed on each visualization, not the conditions that trigger alerts. To change the conditions that trigger an alert, you should edit the alert.
-
Hover over the visualization and select

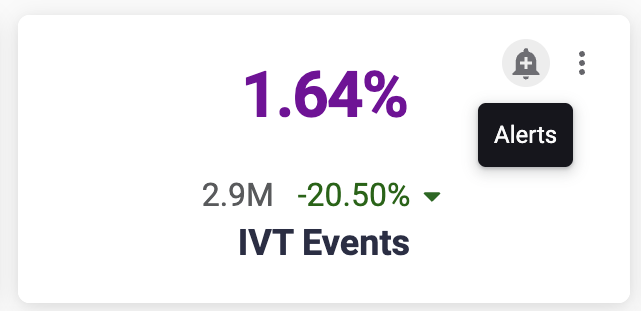
An alert creation window opens.
-
Customize the name, condition, recipient(s), and frequency of your alert.
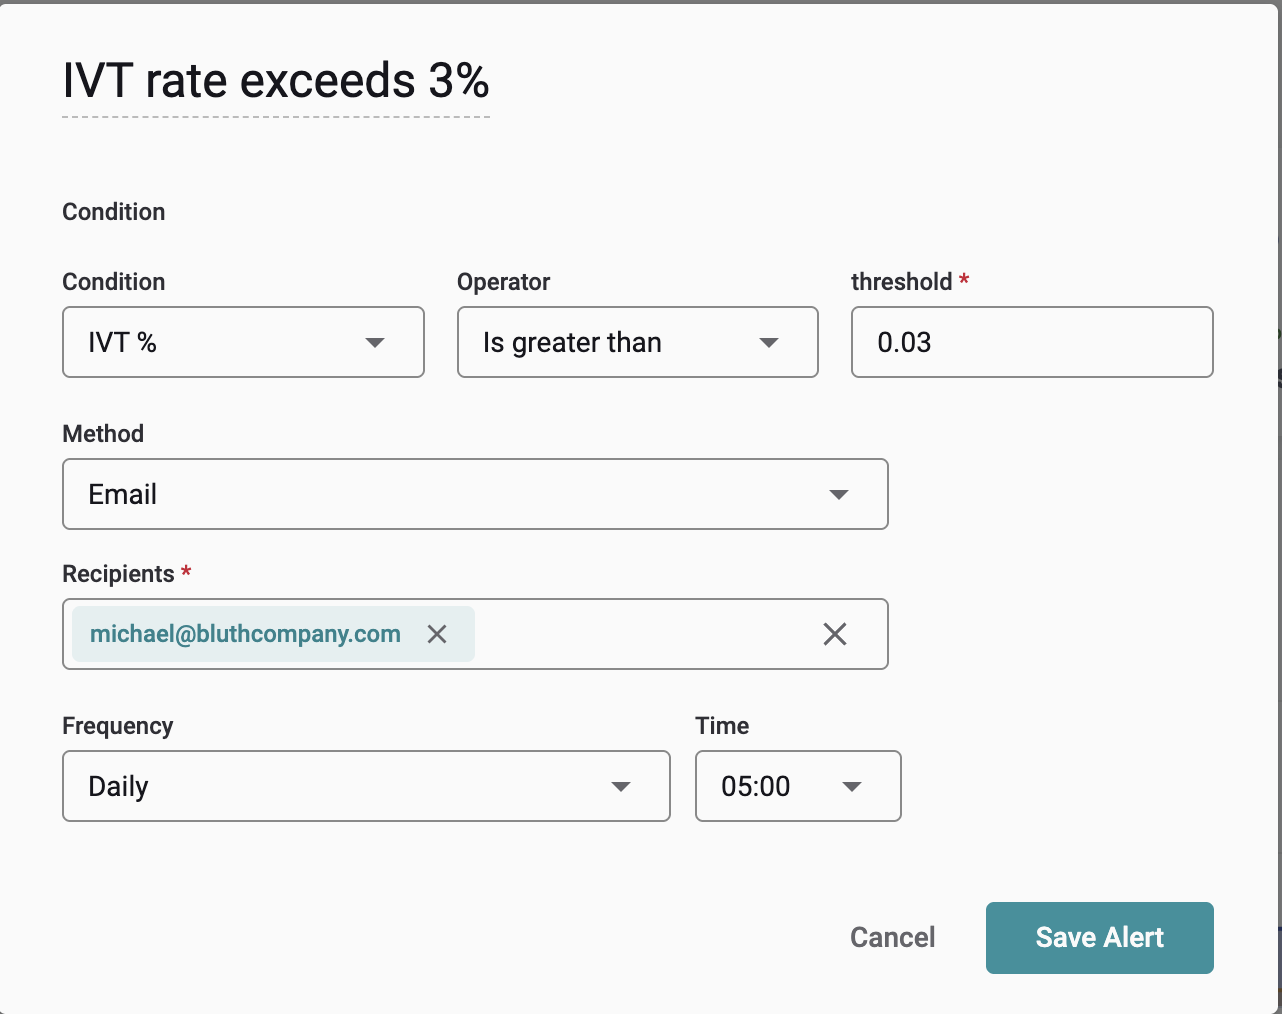
- Alert name field (not labeled): The name of your alert. HUMAN assigns all alerts a default name, but you can override this with a name of your choosing.
- Condition: The data condition that must be met to trigger the alert. Each condition consists of a data metric, a constraint, and a numeric value. For example, to receive an alert when Invalid Traffic (IVT) Events exceed 3% of your total traffic, select the IVT % metric and Is greater than constraint. Then enter 0.03 in the associated text box.
- Recipient: The person (or people) who should receive an email notification if your alert’s condition is met. An alert must have at least one recipient.
- Frequency: How often HUMAN checks your data for changes. For example, if you create an alert with a daily frequency, HUMAN will analyze your data once a day and send you an email notification if your alert’s conditions were met during that check. You can configure an alert’s frequency to run on a monthly, weekly, or daily basis, or to run multiple times a day in intervals as long as every 12 hours or as short as every 15 minutes.
-
Select Save Alert.
To edit, duplicate, or delete an existing alert, select ![]() and then select
and then select ![]() next to the alert’s name. To create a new alert, select New.
next to the alert’s name. To create a new alert, select New.