BotGuard for Applications (Dashboard)
BotGuard for Applications protects your website or mobile application from bots and fraudulent automated traffic.
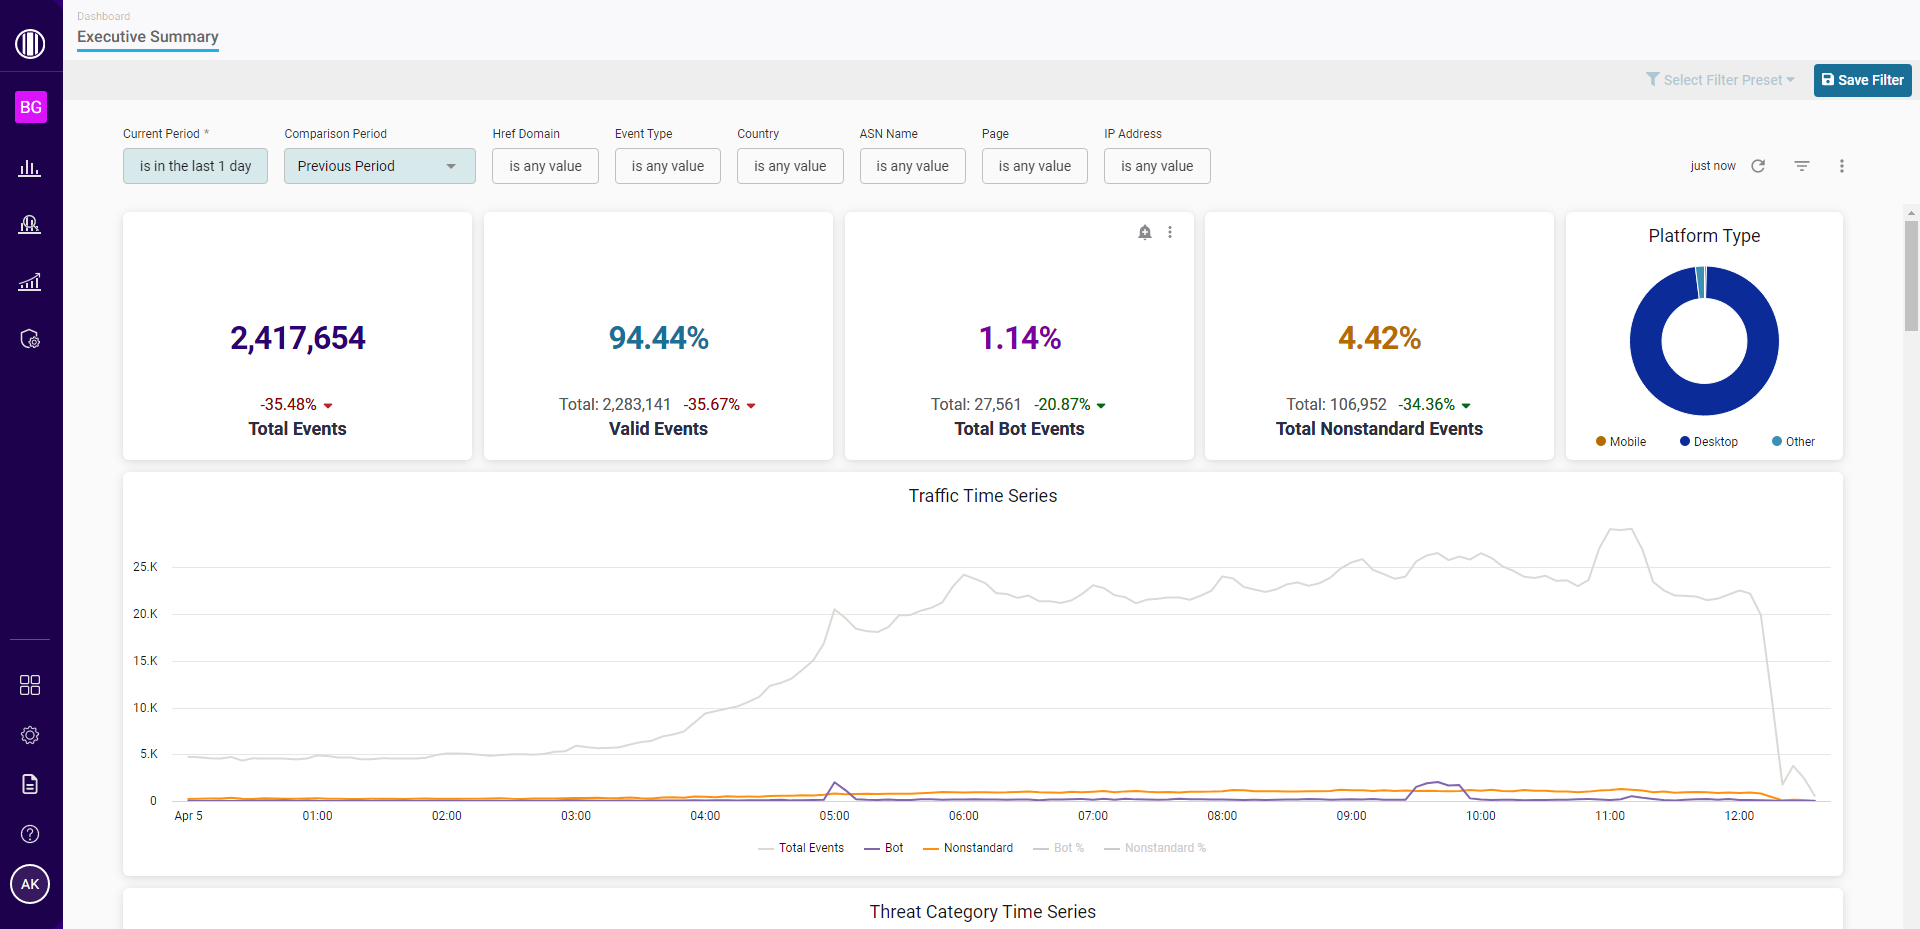
BotGuard for Applications’ Summary page provides an overview of your protected application’s traffic in near-real time. In addition to the standard Summary elements shared across all HUMAN products, this page offers several elements specific to BotGuard for Applications’ capabilities.
There are two BotGuard for Applications dashboards: Traffic Overview and Transaction Details.
Filters
You can use filters to customize the data displayed on BotGuard for Application’s Summary page. These filters include:
- Current Period: The time period for which traffic data will be displayed.
- Comparison Period: [Traffic Overview only] The time period to which current traffic data will be compared (as percentage-over-time trends in the Traffic Metrics pane and certain tables). If your Current Period filter corresponds to a length of time greater than three months, the Comparison Period will be limited to the three months immediately preceding your current traffic data.
- Href Domain: The domain where an event occurred.
- Event Type: The type of event that occurred (for example, an account login or an interaction with a button).
- Country: The country from which an event originated.
- ASN Name: The autonomous system through which an event was routed.
- Page: The full URL of the page where an event occurred.
For the Current Period filter, the is in the last constraint calculates time periods using calendar benchmarks rather than counting backwards from the date and time at which the filter is created.
For example, if you create a filter to show data within the past month, you will see data starting from the 1st day of the current calendar month rather than data from the past 30 days. As a result, you may see empty data for the remaining part of the month that has yet to occur. The same time period logic applies to days (which start at midnight), weeks (which start on Monday), and years (which start on January 1st).
To create week or month filters that count backwards from the current date and time, you can create a filter for is in the last <7 days> or is in the last <30 days> instead.
After you’ve adjusted these filters, select the Reload ![]() icon to update your MediaGuard data.
icon to update your MediaGuard data.
Traffic Overview
BotGuard for Applications’ Traffic Overview dashboard includes multiple breakdowns of your traffic data that meets the conditions of the applied filters.
Traffic metrics
A traffic breakdown by event category. These breakdowns include event percentages, event totals, and percentage trends over time.
- Total Events: The total number of recorded events during the selected time frame.
- Total Valid Events: The percentage and number of events that were determined to be valid.
- Total Bot Events: The percentage and number of events that HUMAN flagged as bots.
- Total Nonstandard Events: The percentage and number of events that HUMAN flagged as nonstandard traffic. Traffic is categorized as nonstandard when it is not concretely associated with bot behavior, but still exhibits traits that warrant investigation.
An increase in the percentage of Valid events will be highlighted in green, since this positively impacts the quality of your overall traffic, but an increase in the percentage of Bot or Nonstandard events will be highlighted in red, since this negatively impacts the quality of your overall traffic.
Platform Type
A pie chart that displays the percentage of events by platform origin (Desktop, Mobile, and Other). You can hover over any section of the pie chart to view the percentage and number of events associated with that platform type, or select any of the labels below the pie chart to show/hide that platform’s data in the visualization.
Traffic Time Series
A graph that displays the percentage of total events by category (Bot and Nonstandard), as well as a Total Events metric that displays the number of all combined event types. You can hover over any point on the graph to view the timestamp and percentage/number of events associated with that data point, or select any of the labels below the graph to show/hide that event category’s data in the visualization.
Traffic Time Series
A graph that displays the total number of events by category (Total Events, Bot, and Nonstandard). You can hover over any point on the graph to view the timestamp and percentage/number of events associated with that data point, or select any of the labels below the graph to show/hide that event category’s data in the visualization.
Threat Category Time Series
A graph that displays the total number of events by threat category (as determined by HUMAN’s taxonomy). You can hover over any point on the graph to view the timestamp and percentage/number of events associated with that threat category, or select any of the labels below the graph to show/hide that threat category’s associated events in the visualization.
Threat Category Breakdown
A table with detailed information about the threat categories detected by HUMAN and the percentage of total events that were categorized as each threat type.
Event Type
A table with detailed information about the types of events (like account creation or account logins) that make up your overall traffic, with additional data about the percentage and number of events that were categorized as Bot and Nonstandard.
Traffic Origin (by Bot%)
The percentage of your total bot traffic that originates from particular countries, displayed as an interactive heat map. You can hover over any point on the map to view the percent of events associated with that country.
Top Attack Targets
A column chart that displays the four domains that received the highest number of bot events, as well as the top four threat categories associated with each domain. You can hover over any section of the column chart to view the number of events associated with each domain’s threat categories or select any of the labels below the chart to show/hide that threat category’s associated events in the visualization.
Country
A table with detailed information about the countries from which events originated, with additional data about the number and percentage of events that were categorized as Bot and Nonstandard. This table is limited to 15 rows of data.
ISP
A table with detailed information about the internet service providers (ISPs) through which events were routed, with additional data about the percentage and number of events that were categorized as bots. This table is limited to 15 rows of data.
Page
A table with detailed information about the pages where detected events occurred, with additional data about the percentage and number of events that were categorized as Bot and Nonstandard. This table is limited to 15 rows of data.
User Agent
A table with detailed information about the most prevalent user agent strings associated with each event, with additional data about the percentage and number of events that were categorized as Bot and Nonstandard. These user agent strings include details about the environment from which a user is browsing, including their browser name, browser version, operating system name, and operating system version. This table is limited to 15 rows of data.
Safe Bots
A radial bar chart that displays the number of non-malicious bots and automated scripts driving traffic to your site. These safe bots are broken into three classes: crawlers, aggregators, and monitors. You can hover over any section of the chart to view the names and number of events associated with each class, or select any of the labels below the chart to show/hide that name’s associated events in the visualization.
Transaction Details
![]()
BotGuard for Applications’ Transaction Details dashboard displays transaction-level data from individual events that meet the conditions of the applied filters. Each row in the Transaction Details table corresponds to a single event, with columns for associated data fields (including the event’s timestamp, country of origin, referring URL, and HUMAN’s threat analysis).
You can select column headers for each field to sort data by that field, in either ascending or descending order.